
Should We Worry About Nebelhornbahn-Aktiengesellschaft's (MUN:NHB) P/E Ratio?

This article is written for those who want to get better at using price to earnings ratios (P/E ratios). We'll look at Nebelhornbahn-Aktiengesellschaft's (MUN:NHB) P/E ratio and reflect on what it tells us about the company's share price. Based on the last twelve months, Nebelhornbahn-Aktiengesellschaft's P/E ratio is 72.72. That means that at current prices, buyers pay €72.72 for every €1 in trailing yearly profits.
See our latest analysis for Nebelhornbahn-Aktiengesellschaft
How Do You Calculate A P/E Ratio?
The formula for price to earnings is:
Price to Earnings Ratio = Share Price ÷ Earnings per Share (EPS)
Or for Nebelhornbahn-Aktiengesellschaft:
P/E of 72.72 = €24.000 ÷ €0.330 (Based on the year to October 2019.)
(Note: the above calculation results may not be precise due to rounding.)
Is A High Price-to-Earnings Ratio Good?
The higher the P/E ratio, the higher the price tag of a business, relative to its trailing earnings. That is not a good or a bad thing per se, but a high P/E does imply buyers are optimistic about the future.
Does Nebelhornbahn-Aktiengesellschaft Have A Relatively High Or Low P/E For Its Industry?
The P/E ratio essentially measures market expectations of a company. The image below shows that Nebelhornbahn-Aktiengesellschaft has a significantly higher P/E than the average (22.8) P/E for companies in the hospitality industry.
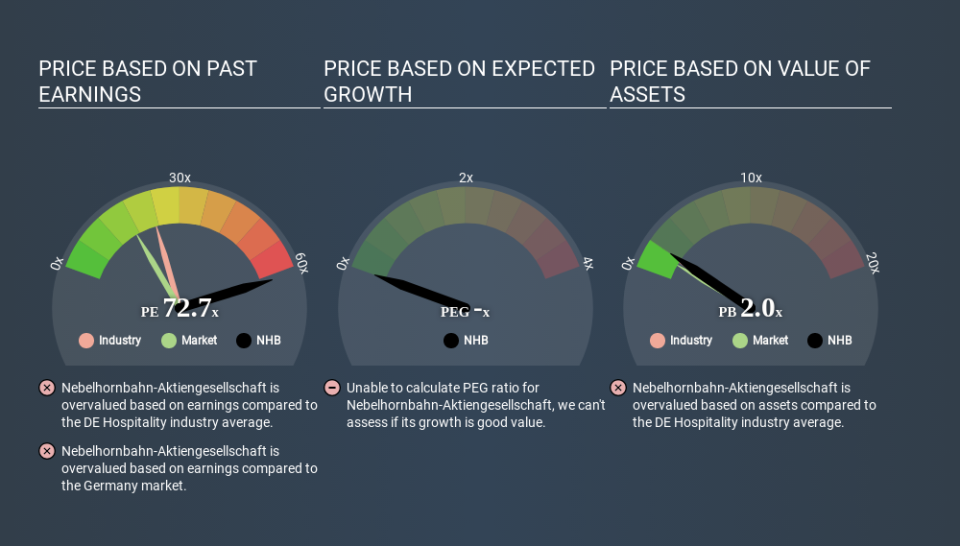
Its relatively high P/E ratio indicates that Nebelhornbahn-Aktiengesellschaft shareholders think it will perform better than other companies in its industry classification. The market is optimistic about the future, but that doesn't guarantee future growth. So investors should always consider the P/E ratio alongside other factors, such as whether company directors have been buying shares.
How Growth Rates Impact P/E Ratios
If earnings fall then in the future the 'E' will be lower. Therefore, even if you pay a low multiple of earnings now, that multiple will become higher in the future. A higher P/E should indicate the stock is expensive relative to others -- and that may encourage shareholders to sell.
Nebelhornbahn-Aktiengesellschaft's earnings per share fell by 16% in the last twelve months. And it has shrunk its earnings per share by 1.9% per year over the last five years. This might lead to muted expectations.
Don't Forget: The P/E Does Not Account For Debt or Bank Deposits
Don't forget that the P/E ratio considers market capitalization. In other words, it does not consider any debt or cash that the company may have on the balance sheet. Theoretically, a business can improve its earnings (and produce a lower P/E in the future) by investing in growth. That means taking on debt (or spending its cash).
Spending on growth might be good or bad a few years later, but the point is that the P/E ratio does not account for the option (or lack thereof).
How Does Nebelhornbahn-Aktiengesellschaft's Debt Impact Its P/E Ratio?
Nebelhornbahn-Aktiengesellschaft has net debt equal to 40% of its market cap. While it's worth keeping this in mind, it isn't a worry.
The Verdict On Nebelhornbahn-Aktiengesellschaft's P/E Ratio
With a P/E ratio of 72.7, Nebelhornbahn-Aktiengesellschaft is expected to grow earnings very strongly in the years to come. With some debt but no EPS growth last year, the market has high expectations of future profits.
Investors have an opportunity when market expectations about a stock are wrong. People often underestimate remarkable growth -- so investors can make money when fast growth is not fully appreciated. Although we don't have analyst forecasts shareholders might want to examine this detailed historical graph of earnings, revenue and cash flow.
Of course you might be able to find a better stock than Nebelhornbahn-Aktiengesellschaft. So you may wish to see this free collection of other companies that have grown earnings strongly.
If you spot an error that warrants correction, please contact the editor at editorial-team@simplywallst.com. This article by Simply Wall St is general in nature. It does not constitute a recommendation to buy or sell any stock, and does not take account of your objectives, or your financial situation. Simply Wall St has no position in the stocks mentioned.
We aim to bring you long-term focused research analysis driven by fundamental data. Note that our analysis may not factor in the latest price-sensitive company announcements or qualitative material. Thank you for reading.

