
A Sliding Share Price Has Us Looking At Bouygues SA's (EPA:EN) P/E Ratio

Unfortunately for some shareholders, the Bouygues (EPA:EN) share price has dived 33% in the last thirty days. The recent drop has obliterated the annual return, with the share price now down 27% over that longer period.
Assuming nothing else has changed, a lower share price makes a stock more attractive to potential buyers. While the market sentiment towards a stock is very changeable, in the long run, the share price will tend to move in the same direction as earnings per share. The implication here is that long term investors have an opportunity when expectations of a company are too low. One way to gauge market expectations of a stock is to look at its Price to Earnings Ratio (PE Ratio). A high P/E ratio means that investors have a high expectation about future growth, while a low P/E ratio means they have low expectations about future growth.
Check out our latest analysis for Bouygues
Does Bouygues Have A Relatively High Or Low P/E For Its Industry?
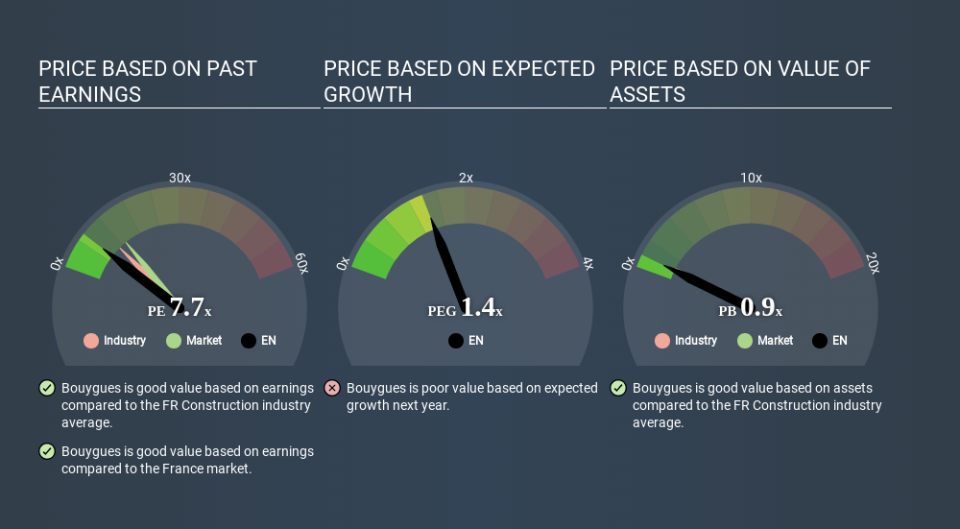
Bouygues's P/E of 7.67 indicates relatively low sentiment towards the stock. If you look at the image below, you can see Bouygues has a lower P/E than the average (9.9) in the construction industry classification.
Bouygues's P/E tells us that market participants think it will not fare as well as its peers in the same industry. Since the market seems unimpressed with Bouygues, it's quite possible it could surprise on the upside. It is arguably worth checking if insiders are buying shares, because that might imply they believe the stock is undervalued.
How Growth Rates Impact P/E Ratios
Generally speaking the rate of earnings growth has a profound impact on a company's P/E multiple. That's because companies that grow earnings per share quickly will rapidly increase the 'E' in the equation. Therefore, even if you pay a high multiple of earnings now, that multiple will become lower in the future. A lower P/E should indicate the stock is cheap relative to others -- and that may attract buyers.
Bouygues shrunk earnings per share by 11% over the last year. But it has grown its earnings per share by 5.7% per year over the last five years.
A Limitation: P/E Ratios Ignore Debt and Cash In The Bank
Don't forget that the P/E ratio considers market capitalization. So it won't reflect the advantage of cash, or disadvantage of debt. In theory, a company can lower its future P/E ratio by using cash or debt to invest in growth.
Such expenditure might be good or bad, in the long term, but the point here is that the balance sheet is not reflected by this ratio.
So What Does Bouygues's Balance Sheet Tell Us?
Bouygues's net debt is 24% of its market cap. This could bring some additional risk, and reduce the number of investment options for management; worth remembering if you compare its P/E to businesses without debt.
The Verdict On Bouygues's P/E Ratio
Bouygues's P/E is 7.7 which is below average (13.2) in the FR market. With only modest debt, it's likely the lack of EPS growth at least partially explains the pessimism implied by the P/E ratio. What can be absolutely certain is that the market has become more pessimistic about Bouygues over the last month, with the P/E ratio falling from 11.4 back then to 7.7 today. For those who prefer invest in growth, this stock apparently offers limited promise, but the deep value investors may find the pessimism around this stock enticing.
Investors should be looking to buy stocks that the market is wrong about. If it is underestimating a company, investors can make money by buying and holding the shares until the market corrects itself. So this free visual report on analyst forecasts could hold the key to an excellent investment decision.
But note: Bouygues may not be the best stock to buy. So take a peek at this free list of interesting companies with strong recent earnings growth (and a P/E ratio below 20).
If you spot an error that warrants correction, please contact the editor at editorial-team@simplywallst.com. This article by Simply Wall St is general in nature. It does not constitute a recommendation to buy or sell any stock, and does not take account of your objectives, or your financial situation. Simply Wall St has no position in the stocks mentioned.
We aim to bring you long-term focused research analysis driven by fundamental data. Note that our analysis may not factor in the latest price-sensitive company announcements or qualitative material. Thank you for reading.

