
Hugo Boss AG (ETR:BOSS) Is Employing Capital Very Effectively

Today we'll look at Hugo Boss AG (ETR:BOSS) and reflect on its potential as an investment. Specifically, we're going to calculate its Return On Capital Employed (ROCE), in the hopes of getting some insight into the business.
First up, we'll look at what ROCE is and how we calculate it. Second, we'll look at its ROCE compared to similar companies. And finally, we'll look at how its current liabilities are impacting its ROCE.
What is Return On Capital Employed (ROCE)?
ROCE is a metric for evaluating how much pre-tax income (in percentage terms) a company earns on the capital invested in its business. In general, businesses with a higher ROCE are usually better quality. In brief, it is a useful tool, but it is not without drawbacks. Author Edwin Whiting says to be careful when comparing the ROCE of different businesses, since 'No two businesses are exactly alike.
So, How Do We Calculate ROCE?
The formula for calculating the return on capital employed is:
Return on Capital Employed = Earnings Before Interest and Tax (EBIT) ÷ (Total Assets - Current Liabilities)
Or for Hugo Boss:
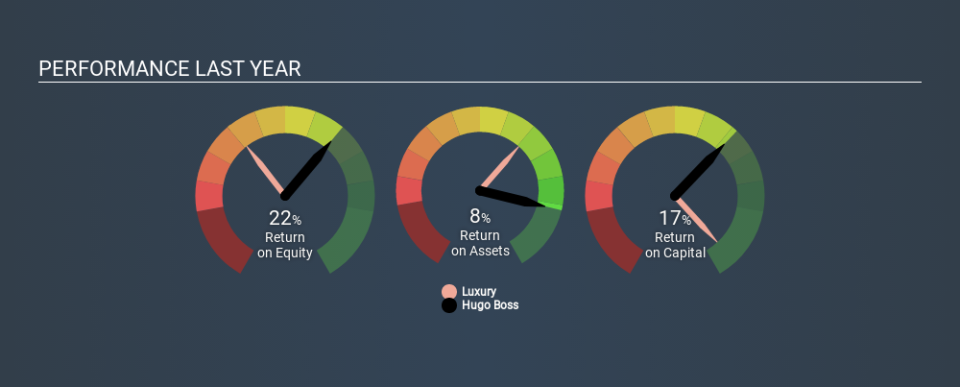
0.17 = €345m ÷ (€2.9b - €850m) (Based on the trailing twelve months to September 2019.)
So, Hugo Boss has an ROCE of 17%.
View our latest analysis for Hugo Boss
Does Hugo Boss Have A Good ROCE?
When making comparisons between similar businesses, investors may find ROCE useful. In our analysis, Hugo Boss's ROCE is meaningfully higher than the 11% average in the Luxury industry. We would consider this a positive, as it suggests it is using capital more effectively than other similar companies. Separate from Hugo Boss's performance relative to its industry, its ROCE in absolute terms looks satisfactory, and it may be worth researching in more depth.
Hugo Boss's current ROCE of 17% is lower than its ROCE in the past, which was 29%, 3 years ago. So investors might consider if it has had issues recently. You can click on the image below to see (in greater detail) how Hugo Boss's past growth compares to other companies.
Remember that this metric is backwards looking - it shows what has happened in the past, and does not accurately predict the future. ROCE can be deceptive for cyclical businesses, as returns can look incredible in boom times, and terribly low in downturns. ROCE is only a point-in-time measure. Since the future is so important for investors, you should check out our free report on analyst forecasts for Hugo Boss.
How Hugo Boss's Current Liabilities Impact Its ROCE
Current liabilities include invoices, such as supplier payments, short-term debt, or a tax bill, that need to be paid within 12 months. Due to the way ROCE is calculated, a high level of current liabilities makes a company look as though it has less capital employed, and thus can (sometimes unfairly) boost the ROCE. To counteract this, we check if a company has high current liabilities, relative to its total assets.
Hugo Boss has total assets of €2.9b and current liabilities of €850m. Therefore its current liabilities are equivalent to approximately 30% of its total assets. Current liabilities are minimal, limiting the impact on ROCE.
The Bottom Line On Hugo Boss's ROCE
With that in mind, Hugo Boss's ROCE appears pretty good. Hugo Boss shapes up well under this analysis, but it is far from the only business delivering excellent numbers . You might also want to check this free collection of companies delivering excellent earnings growth.
I will like Hugo Boss better if I see some big insider buys. While we wait, check out this free list of growing companies with considerable, recent, insider buying.
If you spot an error that warrants correction, please contact the editor at editorial-team@simplywallst.com. This article by Simply Wall St is general in nature. It does not constitute a recommendation to buy or sell any stock, and does not take account of your objectives, or your financial situation. Simply Wall St has no position in the stocks mentioned.
We aim to bring you long-term focused research analysis driven by fundamental data. Note that our analysis may not factor in the latest price-sensitive company announcements or qualitative material. Thank you for reading.

