
Gold (GC) Technical Analysis Price Futures – Big Price Surge after Overtaking Resistance Cluster
Gold futures surged to nearly its highest level of the year on Tuesday, driven by a drop-off in demand for higher-risk assets and lower U.S. Treasury yields. Both moves made gold a more attractive asset. According to the headlines, the catalyst behind the rally was Apple’s surprise warning of lower revenue due to the impact of the coronavirus.
At 21:25 GMT, April Comex gold is trading $1605.30, up $18.90 or +1.19%.
The real reason for the rally were expectations the major central banks will be forced to cut interest rates further or inject additional stimulus into their respective economies. Early Tuesday, the RBA minutes showed policymakers discussed cutting rates at their last meeting on February 4. On Monday, New Zealand’s Prime Minister announced the country’s GDP would come in lower. Also on Monday, China, Singapore and Thailand announced new stimulus measures.
Lower rates and more stimulus are bullish for gold. Don’t call it safe-haven buying.
Daily Technical Analysis
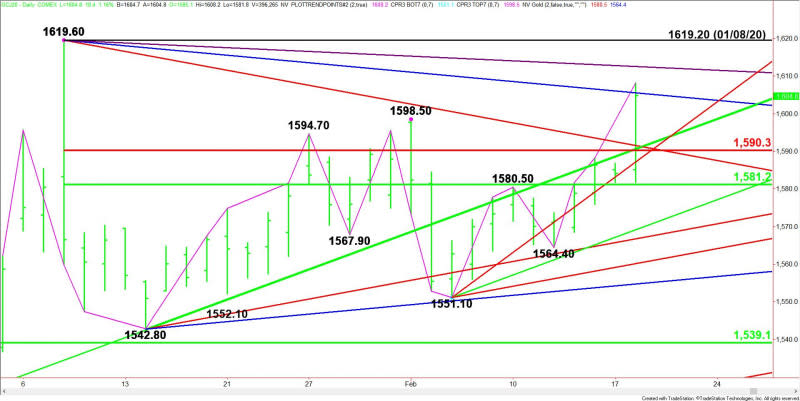
The main trend is up according to the daily swing chart. The uptrend was reaffirmed on Tuesday when buyers took out the February 3 top at $1598.50. The new main bottom is $1564.40. A trade through this bottom will change the main trend to down.
The main range is $1619.60 to $1542.80. Its retracement zone at $1590.30 to $1581.20 is the nearest support zone. Trading above this zone will give the market a strong upside bias.
Tuesday’s Recap
April gold futures surged on Tuesday when buyers took out a potential resistance cluster, starting with the Fibonacci level at $1590.30, and a pair of Gann angles at $1588.80 and $1592.60. This area is new support. The main support is an uptrending Gann angle at $1583.10.
The market received an additional boost later in the session when buyers took out the main top at $1598.50.
Gold ran into resistance at a downtrending Gann angle at $1606.10. Trader reaction to this Gann angle will likely set the tone on Wednesday. Overtaking the angle could drive the market into the next downtrending Gann angle at $1612.90. This is the last potential resistance angle before the January 8 main top at $1619.20.
If buyers can’t sustain a rally over the Gann angle at $1606.10 then look for prices to gradually pullback into support over the near-term.
This article was originally posted on FX Empire
More From FXEMPIRE:
Economic Data Puts the GBP, USD and Loonie in the Spotlight, with the FOMC Minutes also in Focus
EOS, Ethereum and Ripple’s XRP – Daily Tech Analysis – 19/02/20
Oil Price Forecast – Oil Having a Hard Time Getting off the Bottom
Silver Price Forecast – Silver Markets Explode To The Upside
European Equities: Risk Pendulum Swings in Favor of the Bulls Ahead of the Open

