
Don't Sell Orocobre Limited (ASX:ORE) Before You Read This

This article is for investors who would like to improve their understanding of price to earnings ratios (P/E ratios). We'll show how you can use Orocobre Limited's (ASX:ORE) P/E ratio to inform your assessment of the investment opportunity. Orocobre has a P/E ratio of 38.17, based on the last twelve months. That means that at current prices, buyers pay A$38.17 for every A$1 in trailing yearly profits.
See our latest analysis for Orocobre
How Do I Calculate A Price To Earnings Ratio?
The formula for price to earnings is:
Price to Earnings Ratio = Price per Share (in the reporting currency) ÷ Earnings per Share (EPS)
Or for Orocobre:
P/E of 38.17 = USD2.29 (Note: this is the share price in the reporting currency, namely, USD ) ÷ USD0.06 (Based on the year to December 2019.)
Is A High P/E Ratio Good?
The higher the P/E ratio, the higher the price tag of a business, relative to its trailing earnings. That is not a good or a bad thing per se, but a high P/E does imply buyers are optimistic about the future.
Does Orocobre Have A Relatively High Or Low P/E For Its Industry?
We can get an indication of market expectations by looking at the P/E ratio. The image below shows that Orocobre has a higher P/E than the average (12.8) P/E for companies in the metals and mining industry.
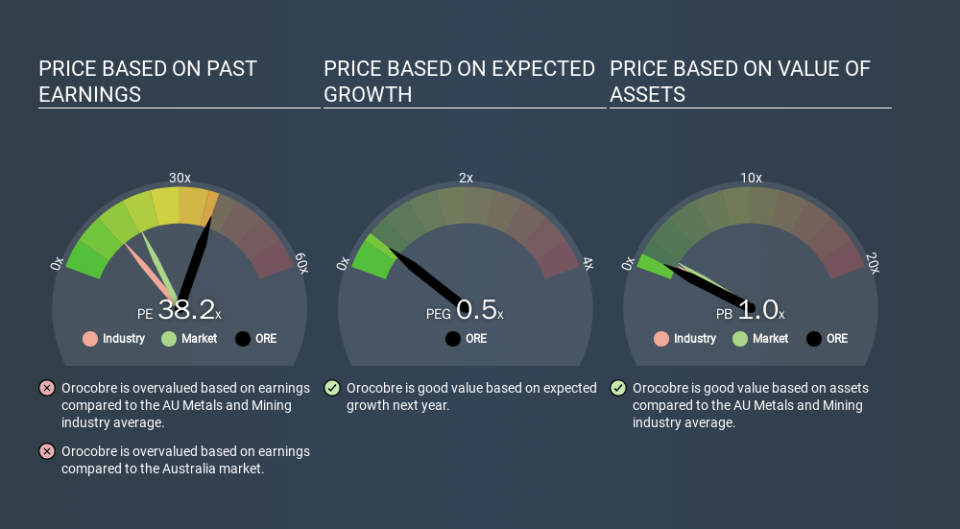
Its relatively high P/E ratio indicates that Orocobre shareholders think it will perform better than other companies in its industry classification. Clearly the market expects growth, but it isn't guaranteed. So further research is always essential. I often monitor director buying and selling.
How Growth Rates Impact P/E Ratios
P/E ratios primarily reflect market expectations around earnings growth rates. Earnings growth means that in the future the 'E' will be higher. That means unless the share price increases, the P/E will reduce in a few years. Then, a lower P/E should attract more buyers, pushing the share price up.
Orocobre saw earnings per share decrease by 13% last year. But EPS is up 27% over the last 3 years.
Remember: P/E Ratios Don't Consider The Balance Sheet
It's important to note that the P/E ratio considers the market capitalization, not the enterprise value. That means it doesn't take debt or cash into account. The exact same company would hypothetically deserve a higher P/E ratio if it had a strong balance sheet, than if it had a weak one with lots of debt, because a cashed up company can spend on growth.
Such spending might be good or bad, overall, but the key point here is that you need to look at debt to understand the P/E ratio in context.
Is Debt Impacting Orocobre's P/E?
Since Orocobre holds net cash of US$18m, it can spend on growth, justifying a higher P/E ratio than otherwise.
The Verdict On Orocobre's P/E Ratio
Orocobre has a P/E of 38.2. That's higher than the average in its market, which is 18.7. The recent drop in earnings per share would make some investors cautious, but the net cash position means the company has time to improve: and the high P/E suggests the market thinks it will.
When the market is wrong about a stock, it gives savvy investors an opportunity. As value investor Benjamin Graham famously said, 'In the short run, the market is a voting machine but in the long run, it is a weighing machine. So this free visual report on analyst forecasts could hold the key to an excellent investment decision.
You might be able to find a better buy than Orocobre. If you want a selection of possible winners, check out this free list of interesting companies that trade on a P/E below 20 (but have proven they can grow earnings).
If you spot an error that warrants correction, please contact the editor at editorial-team@simplywallst.com. This article by Simply Wall St is general in nature. It does not constitute a recommendation to buy or sell any stock, and does not take account of your objectives, or your financial situation. Simply Wall St has no position in the stocks mentioned.
We aim to bring you long-term focused research analysis driven by fundamental data. Note that our analysis may not factor in the latest price-sensitive company announcements or qualitative material. Thank you for reading.

