
How Does Owens Corning's (NYSE:OC) P/E Compare To Its Industry, After The Share Price Drop?

To the annoyance of some shareholders, Owens Corning (NYSE:OC) shares are down a considerable 31% in the last month. The recent drop has obliterated the annual return, with the share price now down 20% over that longer period.
Assuming nothing else has changed, a lower share price makes a stock more attractive to potential buyers. While the market sentiment towards a stock is very changeable, in the long run, the share price will tend to move in the same direction as earnings per share. The implication here is that long term investors have an opportunity when expectations of a company are too low. Perhaps the simplest way to get a read on investors' expectations of a business is to look at its Price to Earnings Ratio (PE Ratio). Investors have optimistic expectations of companies with higher P/E ratios, compared to companies with lower P/E ratios.
Check out our latest analysis for Owens Corning
Does Owens Corning Have A Relatively High Or Low P/E For Its Industry?
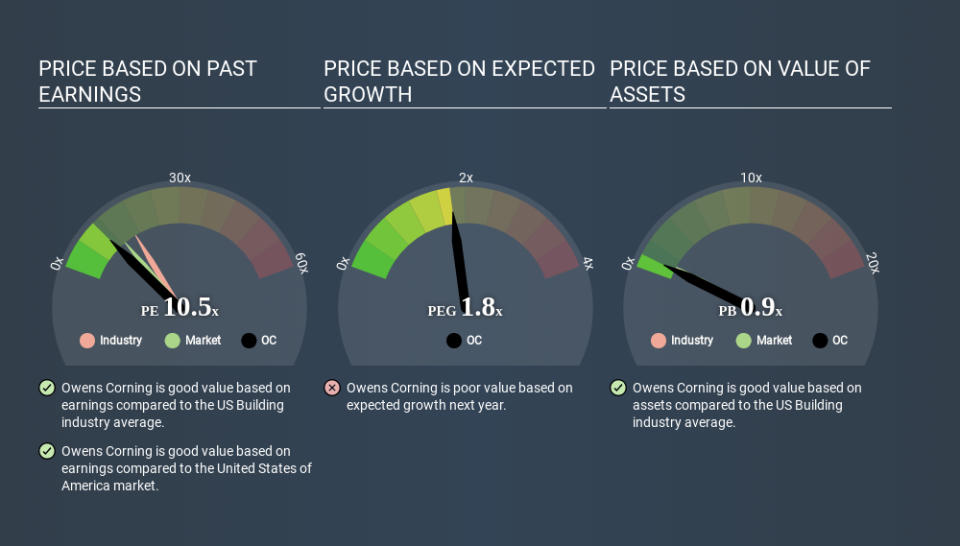
We can tell from its P/E ratio of 10.50 that sentiment around Owens Corning isn't particularly high. We can see in the image below that the average P/E (16.5) for companies in the building industry is higher than Owens Corning's P/E.
Owens Corning's P/E tells us that market participants think it will not fare as well as its peers in the same industry. Many investors like to buy stocks when the market is pessimistic about their prospects. If you consider the stock interesting, further research is recommended. For example, I often monitor director buying and selling.
How Growth Rates Impact P/E Ratios
Probably the most important factor in determining what P/E a company trades on is the earnings growth. When earnings grow, the 'E' increases, over time. That means even if the current P/E is high, it will reduce over time if the share price stays flat. A lower P/E should indicate the stock is cheap relative to others -- and that may attract buyers.
Owens Corning shrunk earnings per share by 25% over the last year. But over the longer term (5 years) earnings per share have increased by 14%.
Remember: P/E Ratios Don't Consider The Balance Sheet
The 'Price' in P/E reflects the market capitalization of the company. So it won't reflect the advantage of cash, or disadvantage of debt. Theoretically, a business can improve its earnings (and produce a lower P/E in the future) by investing in growth. That means taking on debt (or spending its cash).
Spending on growth might be good or bad a few years later, but the point is that the P/E ratio does not account for the option (or lack thereof).
So What Does Owens Corning's Balance Sheet Tell Us?
Net debt totals 67% of Owens Corning's market cap. If you want to compare its P/E ratio to other companies, you should absolutely keep in mind it has significant borrowings.
The Verdict On Owens Corning's P/E Ratio
Owens Corning's P/E is 10.5 which is below average (13.0) in the US market. When you consider that the company has significant debt, and didn't grow EPS last year, it isn't surprising that the market has muted expectations. Given Owens Corning's P/E ratio has declined from 15.2 to 10.5 in the last month, we know for sure that the market is less confident about the business today, than it was back then. For those who don't like to trade against momentum, that could be a warning sign, but a contrarian investor might want to take a closer look.
Investors have an opportunity when market expectations about a stock are wrong. If it is underestimating a company, investors can make money by buying and holding the shares until the market corrects itself. So this free report on the analyst consensus forecasts could help you make a master move on this stock.
Of course you might be able to find a better stock than Owens Corning. So you may wish to see this free collection of other companies that have grown earnings strongly.
If you spot an error that warrants correction, please contact the editor at editorial-team@simplywallst.com. This article by Simply Wall St is general in nature. It does not constitute a recommendation to buy or sell any stock, and does not take account of your objectives, or your financial situation. Simply Wall St has no position in the stocks mentioned.
We aim to bring you long-term focused research analysis driven by fundamental data. Note that our analysis may not factor in the latest price-sensitive company announcements or qualitative material. Thank you for reading.

