
Despite Its High P/E Ratio, Is China Resources Power Holdings Company Limited (HKG:836) Still Undervalued?

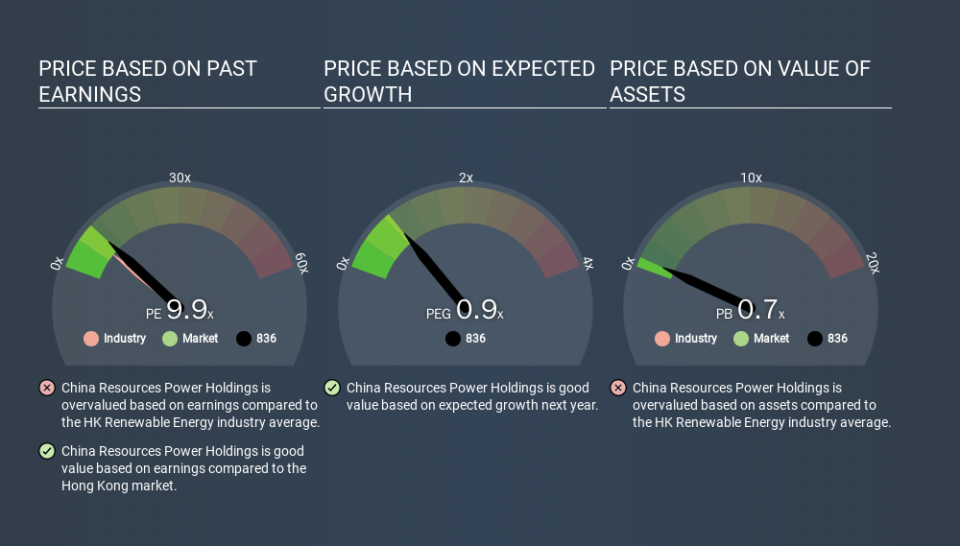
Today, we'll introduce the concept of the P/E ratio for those who are learning about investing. We'll apply a basic P/E ratio analysis to China Resources Power Holdings Company Limited's (HKG:836), to help you decide if the stock is worth further research. China Resources Power Holdings has a P/E ratio of 9.90, based on the last twelve months. That corresponds to an earnings yield of approximately 10.1%.
See our latest analysis for China Resources Power Holdings
How Do You Calculate China Resources Power Holdings's P/E Ratio?
The formula for P/E is:
Price to Earnings Ratio = Price per Share ÷ Earnings per Share (EPS)
Or for China Resources Power Holdings:
P/E of 9.90 = HKD10.34 ÷ HKD1.04 (Based on the trailing twelve months to June 2019.)
Is A High Price-to-Earnings Ratio Good?
A higher P/E ratio means that buyers have to pay a higher price for each HKD1 the company has earned over the last year. That isn't necessarily good or bad, but a high P/E implies relatively high expectations of what a company can achieve in the future.
How Does China Resources Power Holdings's P/E Ratio Compare To Its Peers?
We can get an indication of market expectations by looking at the P/E ratio. The image below shows that China Resources Power Holdings has a higher P/E than the average (8.1) P/E for companies in the renewable energy industry.
Its relatively high P/E ratio indicates that China Resources Power Holdings shareholders think it will perform better than other companies in its industry classification. Clearly the market expects growth, but it isn't guaranteed. So further research is always essential. I often monitor director buying and selling.
How Growth Rates Impact P/E Ratios
When earnings fall, the 'E' decreases, over time. Therefore, even if you pay a low multiple of earnings now, that multiple will become higher in the future. So while a stock may look cheap based on past earnings, it could be expensive based on future earnings.
China Resources Power Holdings saw earnings per share decrease by 13% last year. And over the longer term (5 years) earnings per share have decreased 16% annually. This growth rate might warrant a below average P/E ratio.
A Limitation: P/E Ratios Ignore Debt and Cash In The Bank
Don't forget that the P/E ratio considers market capitalization. So it won't reflect the advantage of cash, or disadvantage of debt. The exact same company would hypothetically deserve a higher P/E ratio if it had a strong balance sheet, than if it had a weak one with lots of debt, because a cashed up company can spend on growth.
Spending on growth might be good or bad a few years later, but the point is that the P/E ratio does not account for the option (or lack thereof).
China Resources Power Holdings's Balance Sheet
China Resources Power Holdings has net debt worth a very significant 191% of its market capitalization. If you want to compare its P/E ratio to other companies, you must keep in mind that these debt levels would usually warrant a relatively low P/E.
The Bottom Line On China Resources Power Holdings's P/E Ratio
China Resources Power Holdings trades on a P/E ratio of 9.9, which is fairly close to the HK market average of 10.1. With relatively high debt, and no earnings per share growth over twelve months, the P/E suggests that many have an expectation that company will find some growth.
Investors should be looking to buy stocks that the market is wrong about. If the reality for a company is not as bad as the P/E ratio indicates, then the share price should increase as the market realizes this. So this free report on the analyst consensus forecasts could help you make a master move on this stock.
Of course you might be able to find a better stock than China Resources Power Holdings. So you may wish to see this free collection of other companies that have grown earnings strongly.
If you spot an error that warrants correction, please contact the editor at editorial-team@simplywallst.com. This article by Simply Wall St is general in nature. It does not constitute a recommendation to buy or sell any stock, and does not take account of your objectives, or your financial situation. Simply Wall St has no position in the stocks mentioned.
We aim to bring you long-term focused research analysis driven by fundamental data. Note that our analysis may not factor in the latest price-sensitive company announcements or qualitative material. Thank you for reading.

