
Should We Worry About American Express Company's (NYSE:AXP) P/E Ratio?

The goal of this article is to teach you how to use price to earnings ratios (P/E ratios). We'll show how you can use American Express Company's (NYSE:AXP) P/E ratio to inform your assessment of the investment opportunity. American Express has a P/E ratio of 17.05, based on the last twelve months. That means that at current prices, buyers pay $17.05 for every $1 in trailing yearly profits.
Check out our latest analysis for American Express
How Do I Calculate American Express's Price To Earnings Ratio?
The formula for price to earnings is:
Price to Earnings Ratio = Price per Share ÷ Earnings per Share (EPS)
Or for American Express:
P/E of 17.05 = USD136.58 ÷ USD8.01 (Based on the year to December 2019.)
Is A High Price-to-Earnings Ratio Good?
The higher the P/E ratio, the higher the price tag of a business, relative to its trailing earnings. That isn't a good or a bad thing on its own, but a high P/E means that buyers have a higher opinion of the business's prospects, relative to stocks with a lower P/E.
How Does American Express's P/E Ratio Compare To Its Peers?
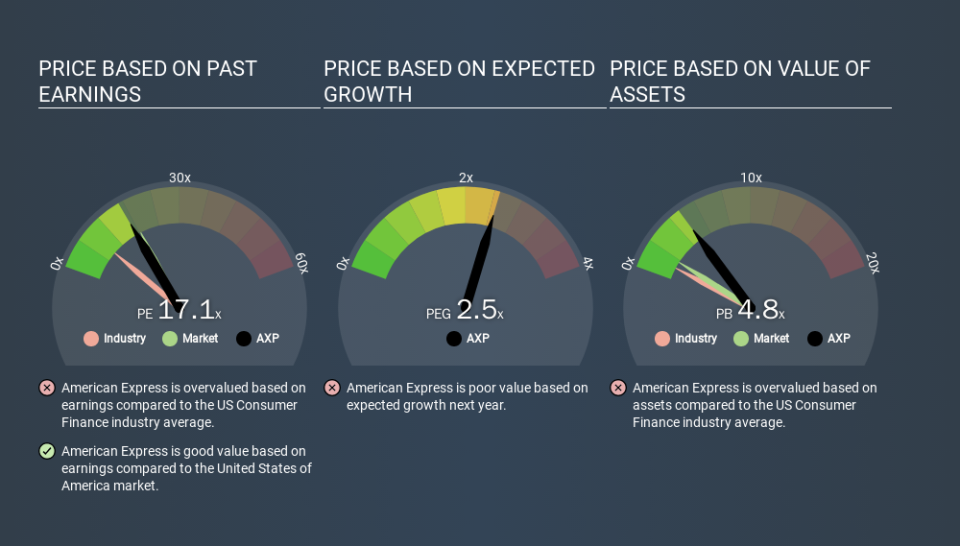
One good way to get a quick read on what market participants expect of a company is to look at its P/E ratio. The image below shows that American Express has a higher P/E than the average (8.8) P/E for companies in the consumer finance industry.
American Express's P/E tells us that market participants think the company will perform better than its industry peers, going forward. Shareholders are clearly optimistic, but the future is always uncertain. So investors should delve deeper. I like to check if company insiders have been buying or selling.
How Growth Rates Impact P/E Ratios
Generally speaking the rate of earnings growth has a profound impact on a company's P/E multiple. If earnings are growing quickly, then the 'E' in the equation will increase faster than it would otherwise. That means unless the share price increases, the P/E will reduce in a few years. And as that P/E ratio drops, the company will look cheap, unless its share price increases.
American Express's earnings per share were pretty steady over the last year. But EPS is up 7.5% over the last 5 years.
Don't Forget: The P/E Does Not Account For Debt or Bank Deposits
The 'Price' in P/E reflects the market capitalization of the company. That means it doesn't take debt or cash into account. Hypothetically, a company could reduce its future P/E ratio by spending its cash (or taking on debt) to achieve higher earnings.
Such spending might be good or bad, overall, but the key point here is that you need to look at debt to understand the P/E ratio in context.
American Express's Balance Sheet
American Express has net debt equal to 37% of its market cap. While that's enough to warrant consideration, it doesn't really concern us.
The Verdict On American Express's P/E Ratio
American Express has a P/E of 17.1. That's below the average in the US market, which is 18.5. The company does have a little debt, and EPS is moving in the right direction. The P/E ratio implies the market is cautious about longer term prospects.
When the market is wrong about a stock, it gives savvy investors an opportunity. If the reality for a company is not as bad as the P/E ratio indicates, then the share price should increase as the market realizes this. So this free report on the analyst consensus forecasts could help you make a master move on this stock.
Of course, you might find a fantastic investment by looking at a few good candidates. So take a peek at this free list of companies with modest (or no) debt, trading on a P/E below 20.
If you spot an error that warrants correction, please contact the editor at editorial-team@simplywallst.com. This article by Simply Wall St is general in nature. It does not constitute a recommendation to buy or sell any stock, and does not take account of your objectives, or your financial situation. Simply Wall St has no position in the stocks mentioned.
We aim to bring you long-term focused research analysis driven by fundamental data. Note that our analysis may not factor in the latest price-sensitive company announcements or qualitative material. Thank you for reading.

