Coronavirus: New interactive maps reveal Australia's worst hit regions

While Australia continues to suppress the coronavirus outbreak, states across the country have warned now is not the time to take the foot off the pedal in terms of their efforts with ongoing restrictions.
And while the country’s leaders and health experts continue to stress that the nation is not pursuing an eradication strategy, they have said it is a plausible by-product of the current restrictions in place.
On Thursday, NSW confirmed five new cases, Tasmania four, Queensland two and Victoria just one.
Mr Morrison announced Australia’s growth rate had dropped to an impressive 0.22 per cent, well below the one per cent target outlined by Chief Medical Officer Brendan Murphy last week in order to suppress the outbreak.
“Those sort of figures were unimaginable weeks ago and they are being achieved because of the patience and discipline and efforts of the Australian people across the country,” Mr Morrison told reporters on Thursday.
However, he warned Australia could easily slip into the same pattern as many European countries such as France and the UK have followed, where death rates are up to 100 times higher than Australia.

"These are all sophisticated, developed economies with good health systems,” he said.
"This can happen in Australia if we are not careful and that is why Australians and our governments have been so careful to balance the needs to get our economy back to a COVID safe level."
Queensland coronavirus red zones
And while some areas of Australia, notably the Northern Territory, have been free of coronavirus for some time now, there are still hotspots across states where cases continue to arise.
In new graphics released by several state governments this week, heat maps now show exactly where the majority of the country’s cases, albeit the majority now non-active, are congregated.
In Queensland, Brisbane (408) and the Gold Coast (189) have the most accumulative cases, while the surrounding areas of Ipswich, Logan and the Sunshine Coast have 27, 42 and 70 cases respectively.
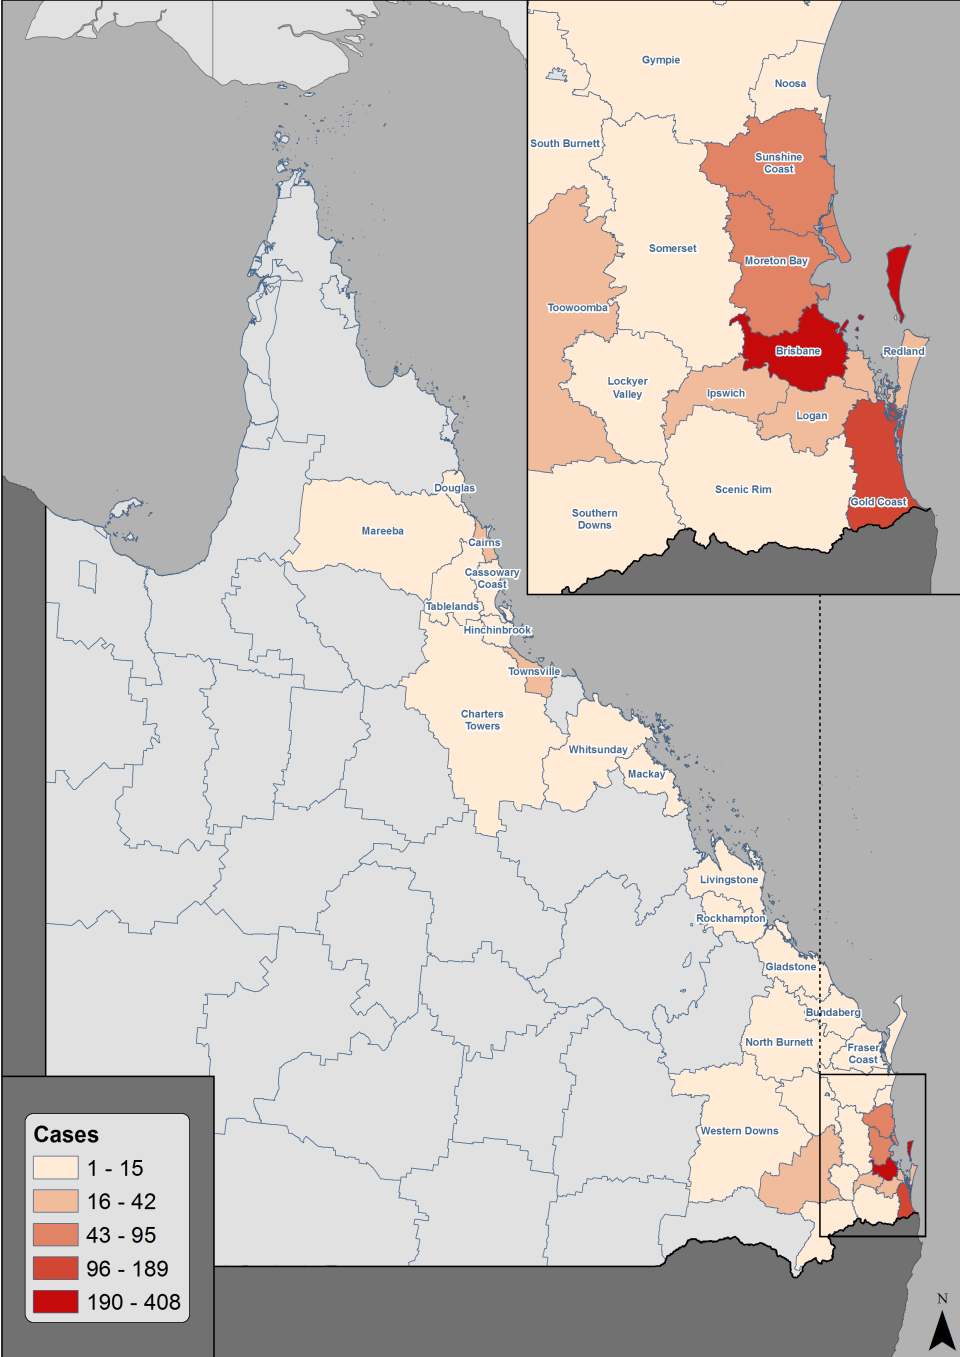
Moreton Bay has 95, while Toowoomba has 37.
In the state’s north, Cairns and Townsville, 24 and 22 respectively, are the current hotspots.
There are currently 280 active cases in the state.
The state considering lifting virus restrictions in weeks – here's what it may look like
Coronavirus cases broken down by suburb – how many are in your area?
WA coronavirus hotspots
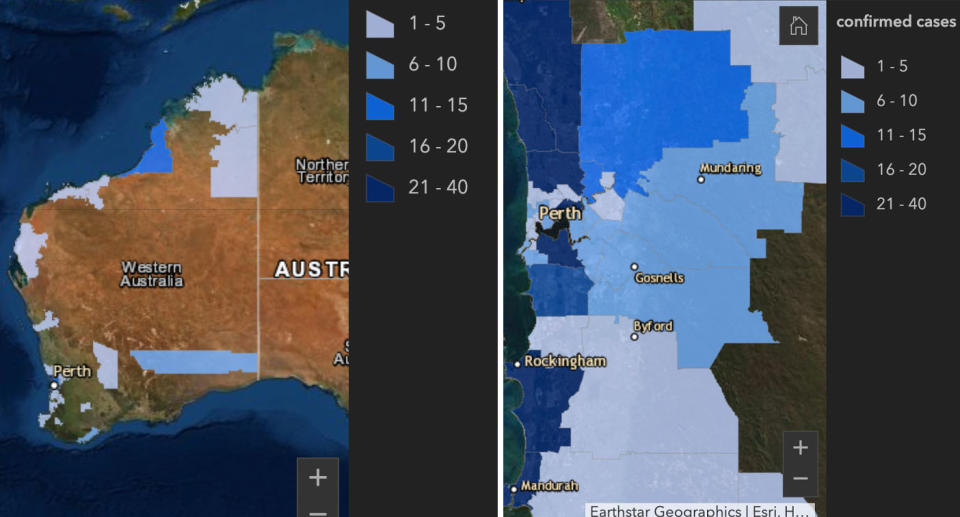
In Western Australia, the City of Stirling in Perth’s north is the current hotspot with 38 accumulative cases.
Joondalup has 35 while Yanchep has 32, both also in Perth’s north.
The shire of Broome on the state’s north coast has a cluster of 11 cases.
There are 89 cases still active in WA.
NSW problem areas
The University of Sydney last week revealed a new interactive map it had developed to indicate the most vulnerable areas of NSW.
The map provides information on the socio-economic status of people as well as what percentage of the residents of that area are aged over 60.
While Sydney’s Waverley council, which incorporates Bondi, had the most cases across the state with 112, the map indicated when it comes to vulnerable residents, Bayview at Sydney’s Northern Beaches was most at risk when it came to an ageing demographic with 46.1 per of people over the age of 60.
There are 937 active cases remaining in NSW.
Victorian data shows Melbourne’s trouble spots
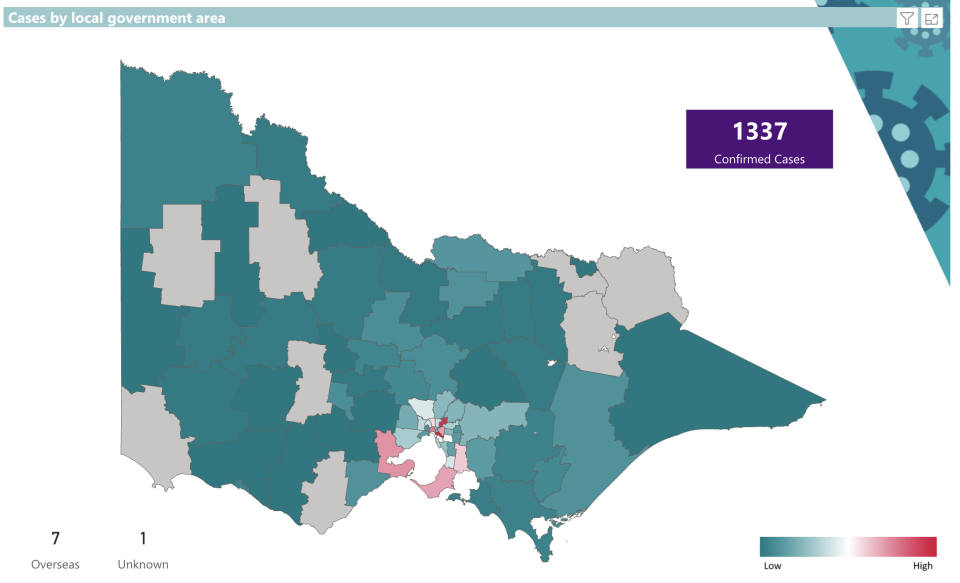
For Victoria, state maps show two local council areas in Melbourne have been hit worse than others.
Stonnington Council in Melbourne’s inner southeast and Banyule in its northeast have been worst hit with 87 and 82 cases respectively.
There are 70 active cases remaining in Victoria, according to government data.

Do you have a story tip? Email: newsroomau@yahoonews.com.
You can also follow us on Facebook, Instagram and Twitter and download the Yahoo News app from the App Store or Google Play.