
Update: Johns Lyng Group (ASX:JLG) Stock Gained 52% In The Last Year

These days it's easy to simply buy an index fund, and your returns should (roughly) match the market. But one can do better than that by picking better than average stocks (as part of a diversified portfolio). To wit, the Johns Lyng Group Limited (ASX:JLG) share price is 52% higher than it was a year ago, much better than the market decline of around 10% (not including dividends) in the same period. So that should have shareholders smiling. We'll need to follow Johns Lyng Group for a while to get a better sense of its share price trend, since it hasn't been listed for particularly long.
View our latest analysis for Johns Lyng Group
While the efficient markets hypothesis continues to be taught by some, it has been proven that markets are over-reactive dynamic systems, and investors are not always rational. One way to examine how market sentiment has changed over time is to look at the interaction between a company's share price and its earnings per share (EPS).
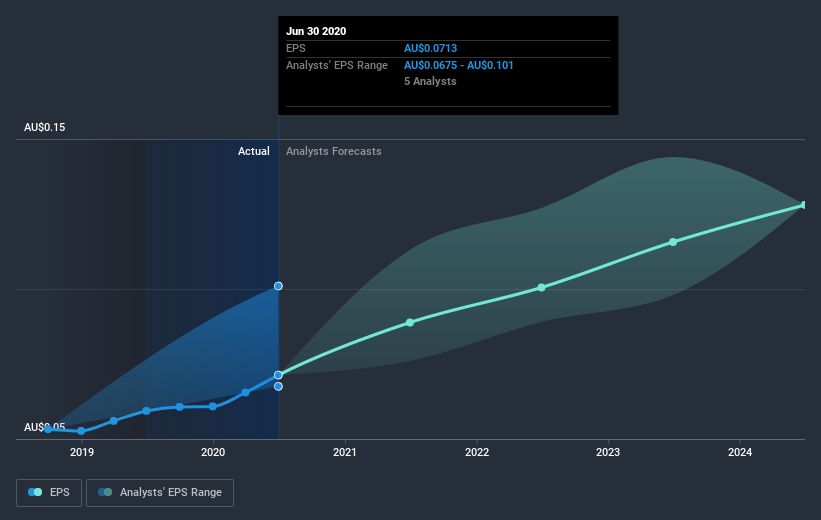
During the last year Johns Lyng Group grew its earnings per share (EPS) by 20%. This EPS growth is significantly lower than the 52% increase in the share price. This indicates that the market is now more optimistic about the stock.
The company's earnings per share (over time) is depicted in the image below (click to see the exact numbers).
We consider it positive that insiders have made significant purchases in the last year. Even so, future earnings will be far more important to whether current shareholders make money. This free interactive report on Johns Lyng Group's earnings, revenue and cash flow is a great place to start, if you want to investigate the stock further.
What About Dividends?
As well as measuring the share price return, investors should also consider the total shareholder return (TSR). The TSR is a return calculation that accounts for the value of cash dividends (assuming that any dividend received was reinvested) and the calculated value of any discounted capital raisings and spin-offs. It's fair to say that the TSR gives a more complete picture for stocks that pay a dividend. We note that for Johns Lyng Group the TSR over the last year was 54%, which is better than the share price return mentioned above. This is largely a result of its dividend payments!
A Different Perspective
It's nice to see that Johns Lyng Group shareholders have gained 54% over the last year, including dividends. A substantial portion of that gain has come in the last three months, with the stock up 20% in that time. This suggests the company is continuing to win over new investors. If you want to research this stock further, the data on insider buying is an obvious place to start. You can click here to see who has been buying shares - and the price they paid.
If you like to buy stocks alongside management, then you might just love this free list of companies. (Hint: insiders have been buying them).
Please note, the market returns quoted in this article reflect the market weighted average returns of stocks that currently trade on AU exchanges.
This article by Simply Wall St is general in nature. It does not constitute a recommendation to buy or sell any stock, and does not take account of your objectives, or your financial situation. We aim to bring you long-term focused analysis driven by fundamental data. Note that our analysis may not factor in the latest price-sensitive company announcements or qualitative material. Simply Wall St has no position in any stocks mentioned.
Have feedback on this article? Concerned about the content? Get in touch with us directly. Alternatively, email editorial-team@simplywallst.com.

