
How Does Air Partner's (LON:AIR) P/E Compare To Its Industry, After The Share Price Drop?

To the annoyance of some shareholders, Air Partner (LON:AIR) shares are down a considerable 35% in the last month. Indeed the recent decline has arguably caused some bitterness for shareholders who have held through the 37% drop over twelve months.
Assuming nothing else has changed, a lower share price makes a stock more attractive to potential buyers. While the market sentiment towards a stock is very changeable, in the long run, the share price will tend to move in the same direction as earnings per share. So, on certain occasions, long term focussed investors try to take advantage of pessimistic expectations to buy shares at a better price. One way to gauge market expectations of a stock is to look at its Price to Earnings Ratio (PE Ratio). Investors have optimistic expectations of companies with higher P/E ratios, compared to companies with lower P/E ratios.
View our latest analysis for Air Partner
How Does Air Partner's P/E Ratio Compare To Its Peers?
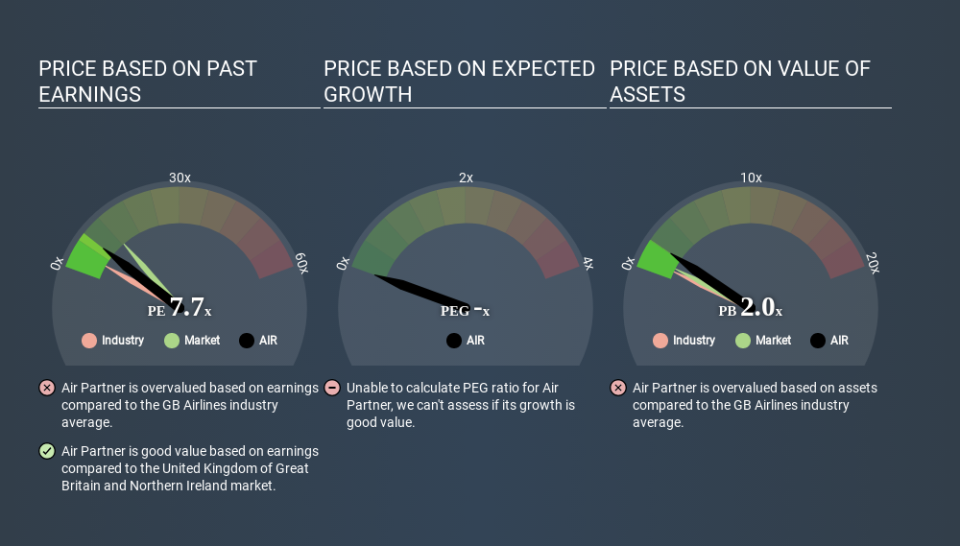
We can tell from its P/E ratio of 7.74 that there is some investor optimism about Air Partner. You can see in the image below that the average P/E (4.2) for companies in the airlines industry is lower than Air Partner's P/E.
Its relatively high P/E ratio indicates that Air Partner shareholders think it will perform better than other companies in its industry classification. Shareholders are clearly optimistic, but the future is always uncertain. So investors should always consider the P/E ratio alongside other factors, such as whether company directors have been buying shares.
How Growth Rates Impact P/E Ratios
P/E ratios primarily reflect market expectations around earnings growth rates. When earnings grow, the 'E' increases, over time. That means unless the share price increases, the P/E will reduce in a few years. And as that P/E ratio drops, the company will look cheap, unless its share price increases.
Air Partner increased earnings per share by 9.5% last year. And its annual EPS growth rate over 5 years is 14%.
Don't Forget: The P/E Does Not Account For Debt or Bank Deposits
It's important to note that the P/E ratio considers the market capitalization, not the enterprise value. Thus, the metric does not reflect cash or debt held by the company. In theory, a company can lower its future P/E ratio by using cash or debt to invest in growth.
While growth expenditure doesn't always pay off, the point is that it is a good option to have; but one that the P/E ratio ignores.
Is Debt Impacting Air Partner's P/E?
With net cash of UK£4.3m, Air Partner has a very strong balance sheet, which may be important for its business. Having said that, at 17% of its market capitalization the cash hoard would contribute towards a higher P/E ratio.
The Verdict On Air Partner's P/E Ratio
Air Partner has a P/E of 7.7. That's below the average in the GB market, which is 12.3. Recent earnings growth wasn't bad. Also positive, the relatively strong balance sheet will allow for investment in growth. In contrast, the P/E indicates shareholders doubt that will happen! Given Air Partner's P/E ratio has declined from 12.0 to 7.7 in the last month, we know for sure that the market is more worried about the business today, than it was back then. For those who prefer to invest with the flow of momentum, that might be a bad sign, but for deep value investors this stock might justify some research.
Investors have an opportunity when market expectations about a stock are wrong. As value investor Benjamin Graham famously said, 'In the short run, the market is a voting machine but in the long run, it is a weighing machine. So this free visual report on analyst forecasts could hold the key to an excellent investment decision.
But note: Air Partner may not be the best stock to buy. So take a peek at this free list of interesting companies with strong recent earnings growth (and a P/E ratio below 20).
If you spot an error that warrants correction, please contact the editor at editorial-team@simplywallst.com. This article by Simply Wall St is general in nature. It does not constitute a recommendation to buy or sell any stock, and does not take account of your objectives, or your financial situation. Simply Wall St has no position in the stocks mentioned.
We aim to bring you long-term focused research analysis driven by fundamental data. Note that our analysis may not factor in the latest price-sensitive company announcements or qualitative material. Thank you for reading.

