
Crude Oil Price Update – Could Form Trading Range Inside Pair of 50% Levels at $39.57 and $40.72
U.S. West Texas Intermediate crude oil futures finished slightly higher on Tuesday ahead of tomorrow’s weekly U.S. inventory figures, rebounding modestly from the previous day’s steep break that was driven by a surge in overseas coronavirus infections. The market was helped by a private industry report that showed a large gasoline draw despite an unexpected crude inventory build.
On Tuesday, December WTI crude oil settled at $40.09, up $0.24 or 0.60%.
Late Tuesday, the American Petroleum Institute (API) reported a build in crude oil inventories of 691,000 barrels for the week-ending September 18. Analysts were looking for an inventory draw of 2.256-million barrels.
The API also reported a draw in gasoline inventories of 7.735 million barrels of gasoline for the week-ending September 11 – compared to last week’s 3.762-million-barrel build. Analysts had expected a much smaller 614,000-barrel draw for the week.
Distillate inventories were down by 2.104 million barrels for the week, compared to last week’s 1.123-million-barrel draw, while Cushing inventory rose by 298,000 barrels.
Daily Swing Chart Technical Analysis
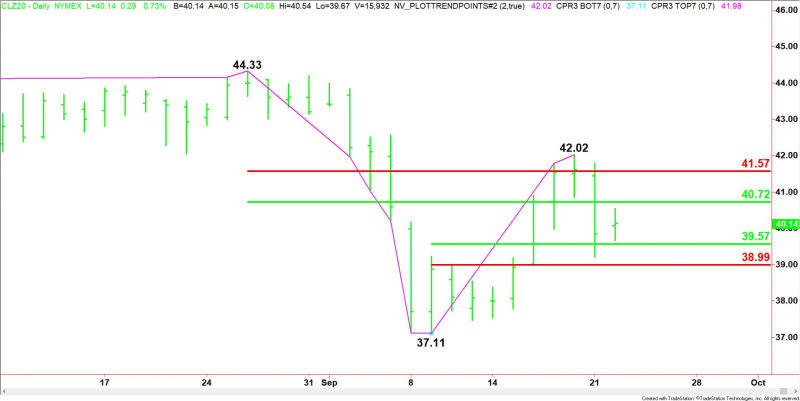
The main trend is down according to the daily swing chart, however, momentum is trending a little higher. A trade through $37.11 will signal a resumption of the downtrend. The main trend will change to up when buyers take out $44.33.
The minor trend is also down. A trade through $42.02 will change the minor trend to up. This move will confirm the shift in momentum to up.
The short-term range is $44.33 to $37.11. Its retracement zone at $40.72 to $41.57 is potential resistance.
The minor range is $37.11 to $42.02. Its retracement zone at $39.57 to $38.99 is support. It stopped the selling at $39.21 on Monday.
Short-Term Outlook
Holding between the two retracement zones will produce a rangebound trade. On the upside, the trigger point for an acceleration is the Fibonacci level at $41.57. Taking out the Fibonacci level at $38.99 could trigger an acceleration to the downside. The daily chart indicates there is plenty of room to the downside with the next major target the September 9 main bottom at $37.11.
Why is a rangebound trade possible? Because some traders believe renewed lockdown restrictions in Europe will have only a limited impact on fuel demand, which could prevent a pronounced selloff in oil markets. Additionally, with major oil-producing nations still restricting supply, the market has been locked in a range for most of the summer. This time, it is likely to be at lower prices.
For a look at all of today’s economic events, check out our economic calendar.
This article was originally posted on FX Empire
More From FXEMPIRE:
AUD/USD Forex Technical Analysis – Decision Time for Aussie Bulls on Test of .7123 to .7055
The Crypto Daily – Movers and Shakers – September 23rd, 2020
US Stock Market Overview – Stocks Rebound Led by the Nasdaq; Housing Sales Rise
Litecoin, Stellar’s Lumen, and Tron’s TRX – Daily Analysis – September 23rd, 2020
EOS, Ethereum and Ripple’s XRP – Daily Tech Analysis – September 23rd, 2020
Gold Price Futures (GC) Technical Analysis – Hovering Above Major Value Area at $1889.70 – $1842.60

