
What Is Baker Hughes's (NYSE:BKR) P/E Ratio After Its Share Price Tanked?

Unfortunately for some shareholders, the Baker Hughes (NYSE:BKR) share price has dived 32% in the last thirty days. That drop has capped off a tough year for shareholders, with the share price down 59% in that time.
All else being equal, a share price drop should make a stock more attractive to potential investors. While the market sentiment towards a stock is very changeable, in the long run, the share price will tend to move in the same direction as earnings per share. The implication here is that long term investors have an opportunity when expectations of a company are too low. One way to gauge market expectations of a stock is to look at its Price to Earnings Ratio (PE Ratio). Investors have optimistic expectations of companies with higher P/E ratios, compared to companies with lower P/E ratios.
See our latest analysis for Baker Hughes
Does Baker Hughes Have A Relatively High Or Low P/E For Its Industry?
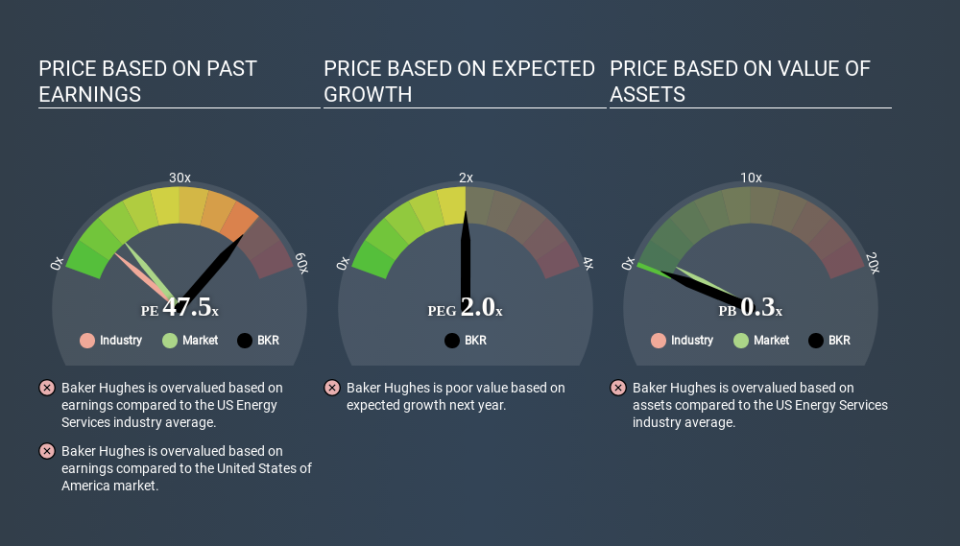
We can tell from its P/E ratio of 47.52 that there is some investor optimism about Baker Hughes. As you can see below, Baker Hughes has a much higher P/E than the average company (8.8) in the energy services industry.
Baker Hughes's P/E tells us that market participants think the company will perform better than its industry peers, going forward. The market is optimistic about the future, but that doesn't guarantee future growth. So investors should delve deeper. I like to check if company insiders have been buying or selling.
How Growth Rates Impact P/E Ratios
Generally speaking the rate of earnings growth has a profound impact on a company's P/E multiple. If earnings are growing quickly, then the 'E' in the equation will increase faster than it would otherwise. Therefore, even if you pay a high multiple of earnings now, that multiple will become lower in the future. And as that P/E ratio drops, the company will look cheap, unless its share price increases.
Baker Hughes's earnings per share fell by 49% in the last twelve months.
Don't Forget: The P/E Does Not Account For Debt or Bank Deposits
It's important to note that the P/E ratio considers the market capitalization, not the enterprise value. That means it doesn't take debt or cash into account. Theoretically, a business can improve its earnings (and produce a lower P/E in the future) by investing in growth. That means taking on debt (or spending its cash).
Spending on growth might be good or bad a few years later, but the point is that the P/E ratio does not account for the option (or lack thereof).
Is Debt Impacting Baker Hughes's P/E?
Baker Hughes's net debt equates to 28% of its market capitalization. While it's worth keeping this in mind, it isn't a worry.
The Bottom Line On Baker Hughes's P/E Ratio
Baker Hughes trades on a P/E ratio of 47.5, which is multiples above its market average of 13.1. With a bit of debt, but a lack of recent growth, it's safe to say the market is expecting improved profit performance from the company, in the next few years. What can be absolutely certain is that the market has become significantly less optimistic about Baker Hughes over the last month, with the P/E ratio falling from 69.8 back then to 47.5 today. For those who prefer to invest with the flow of momentum, that might be a bad sign, but for a contrarian, it may signal opportunity.
Investors should be looking to buy stocks that the market is wrong about. If the reality for a company is better than it expects, you can make money by buying and holding for the long term. So this free visualization of the analyst consensus on future earnings could help you make the right decision about whether to buy, sell, or hold.
You might be able to find a better buy than Baker Hughes. If you want a selection of possible winners, check out this free list of interesting companies that trade on a P/E below 20 (but have proven they can grow earnings).
If you spot an error that warrants correction, please contact the editor at editorial-team@simplywallst.com. This article by Simply Wall St is general in nature. It does not constitute a recommendation to buy or sell any stock, and does not take account of your objectives, or your financial situation. Simply Wall St has no position in the stocks mentioned.
We aim to bring you long-term focused research analysis driven by fundamental data. Note that our analysis may not factor in the latest price-sensitive company announcements or qualitative material. Thank you for reading.

