
Should You Worry About STAAR Surgical Company’s (NASDAQ:STAA) ROCE?

Today we are going to look at STAAR Surgical Company (NASDAQ:STAA) to see whether it might be an attractive investment prospect. To be precise, we'll consider its Return On Capital Employed (ROCE), as that will inform our view of the quality of the business.
Firstly, we'll go over how we calculate ROCE. Second, we'll look at its ROCE compared to similar companies. Finally, we'll look at how its current liabilities affect its ROCE.
Understanding Return On Capital Employed (ROCE)
ROCE is a metric for evaluating how much pre-tax income (in percentage terms) a company earns on the capital invested in its business. All else being equal, a better business will have a higher ROCE. In brief, it is a useful tool, but it is not without drawbacks. Author Edwin Whiting says to be careful when comparing the ROCE of different businesses, since 'No two businesses are exactly alike.
How Do You Calculate Return On Capital Employed?
The formula for calculating the return on capital employed is:
Return on Capital Employed = Earnings Before Interest and Tax (EBIT) ÷ (Total Assets - Current Liabilities)
Or for STAAR Surgical:
0.069 = US$12m ÷ (US$207m - US$34m) (Based on the trailing twelve months to January 2020.)
So, STAAR Surgical has an ROCE of 6.9%.
Check out our latest analysis for STAAR Surgical
Is STAAR Surgical's ROCE Good?
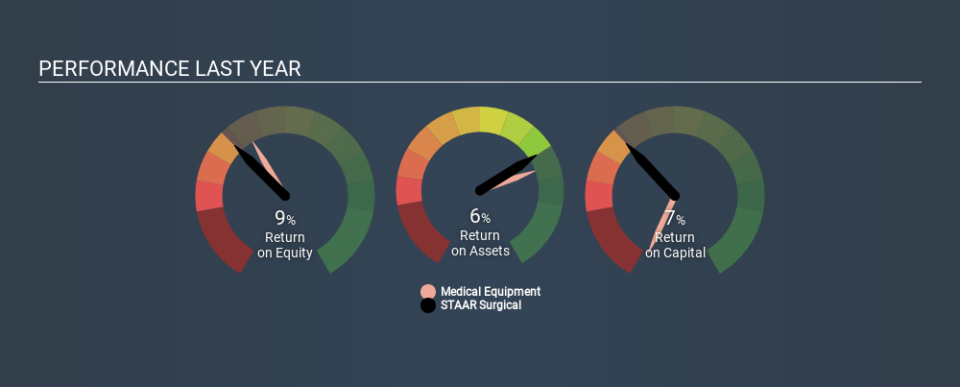
One way to assess ROCE is to compare similar companies. Using our data, STAAR Surgical's ROCE appears to be significantly below the 9.3% average in the Medical Equipment industry. This performance is not ideal, as it suggests the company may not be deploying its capital as effectively as some competitors. Separate from how STAAR Surgical stacks up against its industry, its ROCE in absolute terms is mediocre; relative to the returns on government bonds. Investors may wish to consider higher-performing investments.
STAAR Surgical reported an ROCE of 6.9% -- better than 3 years ago, when the company didn't make a profit. That suggests the business has returned to profitability. The image below shows how STAAR Surgical's ROCE compares to its industry, and you can click it to see more detail on its past growth.
When considering this metric, keep in mind that it is backwards looking, and not necessarily predictive. Companies in cyclical industries can be difficult to understand using ROCE, as returns typically look high during boom times, and low during busts. ROCE is, after all, simply a snap shot of a single year. What happens in the future is pretty important for investors, so we have prepared a free report on analyst forecasts for STAAR Surgical.
How STAAR Surgical's Current Liabilities Impact Its ROCE
Current liabilities include invoices, such as supplier payments, short-term debt, or a tax bill, that need to be paid within 12 months. Due to the way ROCE is calculated, a high level of current liabilities makes a company look as though it has less capital employed, and thus can (sometimes unfairly) boost the ROCE. To counteract this, we check if a company has high current liabilities, relative to its total assets.
STAAR Surgical has current liabilities of US$34m and total assets of US$207m. As a result, its current liabilities are equal to approximately 17% of its total assets. This very reasonable level of current liabilities would not boost the ROCE by much.
The Bottom Line On STAAR Surgical's ROCE
If STAAR Surgical continues to earn an uninspiring ROCE, there may be better places to invest. You might be able to find a better investment than STAAR Surgical. If you want a selection of possible winners, check out this free list of interesting companies that trade on a P/E below 20 (but have proven they can grow earnings).
I will like STAAR Surgical better if I see some big insider buys. While we wait, check out this free list of growing companies with considerable, recent, insider buying.
If you spot an error that warrants correction, please contact the editor at editorial-team@simplywallst.com. This article by Simply Wall St is general in nature. It does not constitute a recommendation to buy or sell any stock, and does not take account of your objectives, or your financial situation. Simply Wall St has no position in the stocks mentioned.
We aim to bring you long-term focused research analysis driven by fundamental data. Note that our analysis may not factor in the latest price-sensitive company announcements or qualitative material. Thank you for reading.

