
Why We Like YUM! Brands, Inc.’s (NYSE:YUM) 47% Return On Capital Employed

Today we are going to look at YUM! Brands, Inc. (NYSE:YUM) to see whether it might be an attractive investment prospect. Specifically, we're going to calculate its Return On Capital Employed (ROCE), in the hopes of getting some insight into the business.
First of all, we'll work out how to calculate ROCE. Second, we'll look at its ROCE compared to similar companies. Finally, we'll look at how its current liabilities affect its ROCE.
Understanding Return On Capital Employed (ROCE)
ROCE is a measure of a company's yearly pre-tax profit (its return), relative to the capital employed in the business. Generally speaking a higher ROCE is better. Ultimately, it is a useful but imperfect metric. Renowned investment researcher Michael Mauboussin has suggested that a high ROCE can indicate that 'one dollar invested in the company generates value of more than one dollar'.
How Do You Calculate Return On Capital Employed?
The formula for calculating the return on capital employed is:
Return on Capital Employed = Earnings Before Interest and Tax (EBIT) ÷ (Total Assets - Current Liabilities)
Or for YUM! Brands:
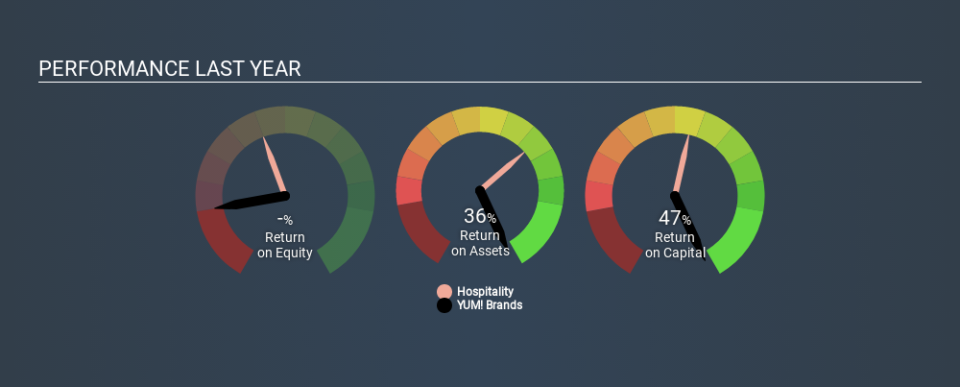
0.47 = US$1.9b ÷ (US$5.0b - US$987m) (Based on the trailing twelve months to September 2019.)
So, YUM! Brands has an ROCE of 47%.
See our latest analysis for YUM! Brands
Does YUM! Brands Have A Good ROCE?
When making comparisons between similar businesses, investors may find ROCE useful. Using our data, we find that YUM! Brands's ROCE is meaningfully better than the 8.5% average in the Hospitality industry. We would consider this a positive, as it suggests it is using capital more effectively than other similar companies. Putting aside its position relative to its industry for now, in absolute terms, YUM! Brands's ROCE is currently very good.
In our analysis, YUM! Brands's ROCE appears to be 47%, compared to 3 years ago, when its ROCE was 14%. This makes us think about whether the company has been reinvesting shrewdly. You can click on the image below to see (in greater detail) how YUM! Brands's past growth compares to other companies.
When considering ROCE, bear in mind that it reflects the past and does not necessarily predict the future. ROCE can be deceptive for cyclical businesses, as returns can look incredible in boom times, and terribly low in downturns. ROCE is, after all, simply a snap shot of a single year. Future performance is what matters, and you can see analyst predictions in our free report on analyst forecasts for the company.
What Are Current Liabilities, And How Do They Affect YUM! Brands's ROCE?
Current liabilities are short term bills and invoices that need to be paid in 12 months or less. Due to the way the ROCE equation works, having large bills due in the near term can make it look as though a company has less capital employed, and thus a higher ROCE than usual. To counter this, investors can check if a company has high current liabilities relative to total assets.
YUM! Brands has total liabilities of US$987m and total assets of US$5.0b. As a result, its current liabilities are equal to approximately 20% of its total assets. A minimal amount of current liabilities limits the impact on ROCE.
What We Can Learn From YUM! Brands's ROCE
Low current liabilities and high ROCE is a good combination, making YUM! Brands look quite interesting. YUM! Brands shapes up well under this analysis, but it is far from the only business delivering excellent numbers . You might also want to check this free collection of companies delivering excellent earnings growth.
If you like to buy stocks alongside management, then you might just love this free list of companies. (Hint: insiders have been buying them).
If you spot an error that warrants correction, please contact the editor at editorial-team@simplywallst.com. This article by Simply Wall St is general in nature. It does not constitute a recommendation to buy or sell any stock, and does not take account of your objectives, or your financial situation. Simply Wall St has no position in the stocks mentioned.
We aim to bring you long-term focused research analysis driven by fundamental data. Note that our analysis may not factor in the latest price-sensitive company announcements or qualitative material. Thank you for reading.

