
Why We’re Not Keen On Ilkka-Yhtymä Oyj’s (HEL:ILK2S) 0.9% Return On Capital

Today we'll look at Ilkka-Yhtymä Oyj (HEL:ILK2S) and reflect on its potential as an investment. In particular, we'll consider its Return On Capital Employed (ROCE), as that can give us insight into how profitably the company is able to employ capital in its business.
Firstly, we'll go over how we calculate ROCE. Second, we'll look at its ROCE compared to similar companies. Last but not least, we'll look at what impact its current liabilities have on its ROCE.
Return On Capital Employed (ROCE): What is it?
ROCE is a metric for evaluating how much pre-tax income (in percentage terms) a company earns on the capital invested in its business. All else being equal, a better business will have a higher ROCE. Ultimately, it is a useful but imperfect metric. Author Edwin Whiting says to be careful when comparing the ROCE of different businesses, since 'No two businesses are exactly alike.
How Do You Calculate Return On Capital Employed?
The formula for calculating the return on capital employed is:
Return on Capital Employed = Earnings Before Interest and Tax (EBIT) ÷ (Total Assets - Current Liabilities)
Or for Ilkka-Yhtymä Oyj:
0.009 = €1.2m ÷ (€147m - €8.9m) (Based on the trailing twelve months to December 2019.)
So, Ilkka-Yhtymä Oyj has an ROCE of 0.9%.
Check out our latest analysis for Ilkka-Yhtymä Oyj
Is Ilkka-Yhtymä Oyj's ROCE Good?
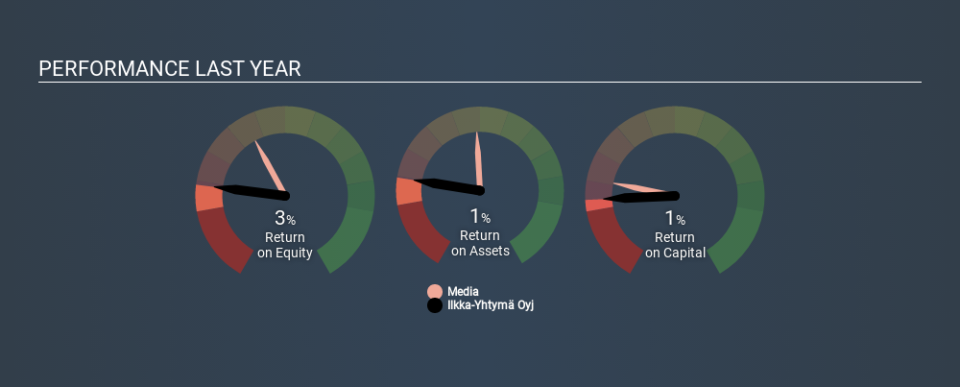
ROCE can be useful when making comparisons, such as between similar companies. We can see Ilkka-Yhtymä Oyj's ROCE is meaningfully below the Media industry average of 10%. This performance is not ideal, as it suggests the company may not be deploying its capital as effectively as some competitors. Independently of how Ilkka-Yhtymä Oyj compares to its industry, its ROCE in absolute terms is low; especially compared to the ~-0.1% available in government bonds. It is likely that there are more attractive prospects out there.
Ilkka-Yhtymä Oyj's current ROCE of 0.9% is lower than its ROCE in the past, which was 2.6%, 3 years ago. This makes us wonder if the business is facing new challenges. You can see in the image below how Ilkka-Yhtymä Oyj's ROCE compares to its industry. Click to see more on past growth.
When considering ROCE, bear in mind that it reflects the past and does not necessarily predict the future. ROCE can be deceptive for cyclical businesses, as returns can look incredible in boom times, and terribly low in downturns. This is because ROCE only looks at one year, instead of considering returns across a whole cycle. Since the future is so important for investors, you should check out our free report on analyst forecasts for Ilkka-Yhtymä Oyj.
How Ilkka-Yhtymä Oyj's Current Liabilities Impact Its ROCE
Current liabilities include invoices, such as supplier payments, short-term debt, or a tax bill, that need to be paid within 12 months. Due to the way ROCE is calculated, a high level of current liabilities makes a company look as though it has less capital employed, and thus can (sometimes unfairly) boost the ROCE. To counteract this, we check if a company has high current liabilities, relative to its total assets.
Ilkka-Yhtymä Oyj has total assets of €147m and current liabilities of €8.9m. As a result, its current liabilities are equal to approximately 6.1% of its total assets. With barely any current liabilities, there is minimal impact on Ilkka-Yhtymä Oyj's admittedly low ROCE.
The Bottom Line On Ilkka-Yhtymä Oyj's ROCE
Still, investors could probably find more attractive prospects with better performance out there. You might be able to find a better investment than Ilkka-Yhtymä Oyj. If you want a selection of possible winners, check out this free list of interesting companies that trade on a P/E below 20 (but have proven they can grow earnings).
For those who like to find winning investments this free list of growing companies with recent insider purchasing, could be just the ticket.
If you spot an error that warrants correction, please contact the editor at editorial-team@simplywallst.com. This article by Simply Wall St is general in nature. It does not constitute a recommendation to buy or sell any stock, and does not take account of your objectives, or your financial situation. Simply Wall St has no position in the stocks mentioned.
We aim to bring you long-term focused research analysis driven by fundamental data. Note that our analysis may not factor in the latest price-sensitive company announcements or qualitative material. Thank you for reading.

