
Why Norway Royal Salmon AS's (OB:NRS) High P/E Ratio Isn't Necessarily A Bad Thing

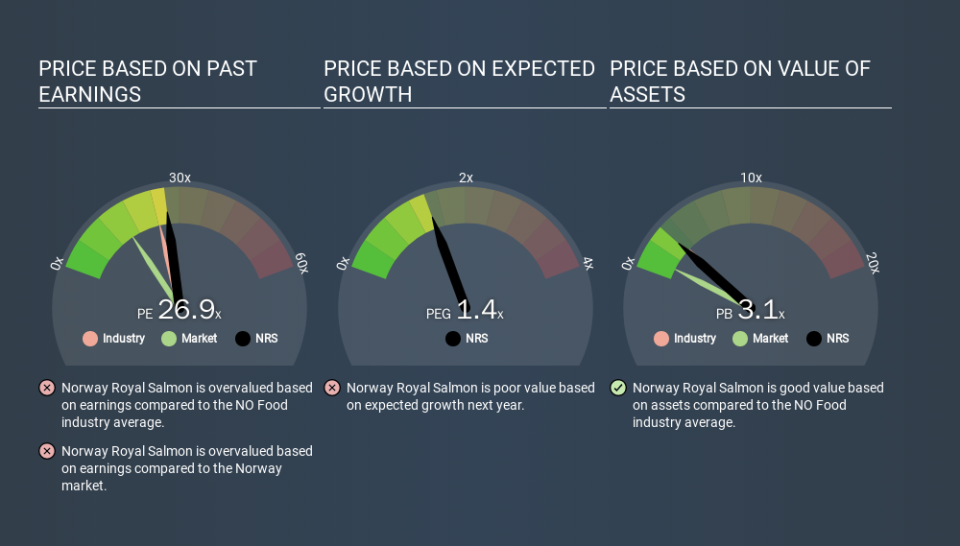
The goal of this article is to teach you how to use price to earnings ratios (P/E ratios). To keep it practical, we'll show how Norway Royal Salmon AS's (OB:NRS) P/E ratio could help you assess the value on offer. Based on the last twelve months, Norway Royal Salmon's P/E ratio is 26.88. That means that at current prices, buyers pay NOK26.88 for every NOK1 in trailing yearly profits.
See our latest analysis for Norway Royal Salmon
How Do I Calculate Norway Royal Salmon's Price To Earnings Ratio?
The formula for P/E is:
Price to Earnings Ratio = Share Price ÷ Earnings per Share (EPS)
Or for Norway Royal Salmon:
P/E of 26.88 = NOK238.20 ÷ NOK8.86 (Based on the year to December 2019.)
Is A High P/E Ratio Good?
A higher P/E ratio means that investors are paying a higher price for each NOK1 of company earnings. That isn't necessarily good or bad, but a high P/E implies relatively high expectations of what a company can achieve in the future.
Does Norway Royal Salmon Have A Relatively High Or Low P/E For Its Industry?
The P/E ratio essentially measures market expectations of a company. As you can see below, Norway Royal Salmon has a higher P/E than the average company (24.2) in the food industry.
Its relatively high P/E ratio indicates that Norway Royal Salmon shareholders think it will perform better than other companies in its industry classification. Clearly the market expects growth, but it isn't guaranteed. So further research is always essential. I often monitor director buying and selling.
How Growth Rates Impact P/E Ratios
Companies that shrink earnings per share quickly will rapidly decrease the 'E' in the equation. Therefore, even if you pay a low multiple of earnings now, that multiple will become higher in the future. Then, a higher P/E might scare off shareholders, pushing the share price down.
Norway Royal Salmon shrunk earnings per share by 45% over the last year. But over the longer term (5 years) earnings per share have increased by 8.7%. And it has shrunk its earnings per share by 27% per year over the last three years. This could justify a low P/E.
Don't Forget: The P/E Does Not Account For Debt or Bank Deposits
One drawback of using a P/E ratio is that it considers market capitalization, but not the balance sheet. In other words, it does not consider any debt or cash that the company may have on the balance sheet. Hypothetically, a company could reduce its future P/E ratio by spending its cash (or taking on debt) to achieve higher earnings.
Spending on growth might be good or bad a few years later, but the point is that the P/E ratio does not account for the option (or lack thereof).
Is Debt Impacting Norway Royal Salmon's P/E?
Norway Royal Salmon has net cash of kr114m. That should lead to a higher P/E than if it did have debt, because its strong balance sheets gives it more options.
The Verdict On Norway Royal Salmon's P/E Ratio
Norway Royal Salmon trades on a P/E ratio of 26.9, which is above its market average of 15.7. Falling earnings per share is probably keeping traditional value investors away, but the healthy balance sheet means the company retains potential for future growth. If fails to eventuate, the current high P/E could prove to be temporary, as the share price falls.
Investors have an opportunity when market expectations about a stock are wrong. People often underestimate remarkable growth -- so investors can make money when fast growth is not fully appreciated. So this free visual report on analyst forecasts could hold the key to an excellent investment decision.
You might be able to find a better buy than Norway Royal Salmon. If you want a selection of possible winners, check out this free list of interesting companies that trade on a P/E below 20 (but have proven they can grow earnings).
If you spot an error that warrants correction, please contact the editor at editorial-team@simplywallst.com. This article by Simply Wall St is general in nature. It does not constitute a recommendation to buy or sell any stock, and does not take account of your objectives, or your financial situation. Simply Wall St has no position in the stocks mentioned.
We aim to bring you long-term focused research analysis driven by fundamental data. Note that our analysis may not factor in the latest price-sensitive company announcements or qualitative material. Thank you for reading.

