
Why Massimo Zanetti Beverage Group S.p.A.'s (BIT:MZB) High P/E Ratio Isn't Necessarily A Bad Thing

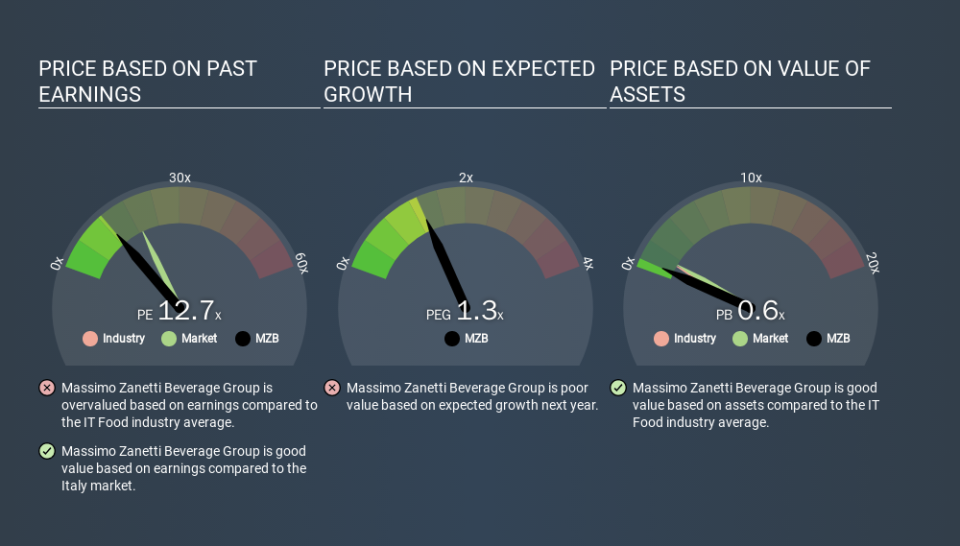
Today, we'll introduce the concept of the P/E ratio for those who are learning about investing. We'll apply a basic P/E ratio analysis to Massimo Zanetti Beverage Group S.p.A.'s (BIT:MZB), to help you decide if the stock is worth further research. Massimo Zanetti Beverage Group has a P/E ratio of 12.73, based on the last twelve months. That means that at current prices, buyers pay €12.73 for every €1 in trailing yearly profits.
View our latest analysis for Massimo Zanetti Beverage Group
How Do You Calculate A P/E Ratio?
The formula for price to earnings is:
Price to Earnings Ratio = Share Price ÷ Earnings per Share (EPS)
Or for Massimo Zanetti Beverage Group:
P/E of 12.73 = EUR5.74 ÷ EUR0.45 (Based on the year to September 2019.)
Is A High P/E Ratio Good?
The higher the P/E ratio, the higher the price tag of a business, relative to its trailing earnings. That isn't necessarily good or bad, but a high P/E implies relatively high expectations of what a company can achieve in the future.
How Does Massimo Zanetti Beverage Group's P/E Ratio Compare To Its Peers?
The P/E ratio indicates whether the market has higher or lower expectations of a company. As you can see below Massimo Zanetti Beverage Group has a P/E ratio that is fairly close for the average for the food industry, which is 12.4.
Its P/E ratio suggests that Massimo Zanetti Beverage Group shareholders think that in the future it will perform about the same as other companies in its industry classification. The company could surprise by performing better than average, in the future. Further research into factors such as insider buying and selling, could help you form your own view on whether that is likely.
How Growth Rates Impact P/E Ratios
If earnings fall then in the future the 'E' will be lower. Therefore, even if you pay a low multiple of earnings now, that multiple will become higher in the future. A higher P/E should indicate the stock is expensive relative to others -- and that may encourage shareholders to sell.
Massimo Zanetti Beverage Group's earnings per share fell by 30% in the last twelve months. And EPS is down 4.6% a year, over the last 5 years. This might lead to muted expectations.
Don't Forget: The P/E Does Not Account For Debt or Bank Deposits
It's important to note that the P/E ratio considers the market capitalization, not the enterprise value. That means it doesn't take debt or cash into account. Theoretically, a business can improve its earnings (and produce a lower P/E in the future) by investing in growth. That means taking on debt (or spending its cash).
Such spending might be good or bad, overall, but the key point here is that you need to look at debt to understand the P/E ratio in context.
Massimo Zanetti Beverage Group's Balance Sheet
Massimo Zanetti Beverage Group's net debt is considerable, at 108% of its market cap. If you want to compare its P/E ratio to other companies, you must keep in mind that these debt levels would usually warrant a relatively low P/E.
The Bottom Line On Massimo Zanetti Beverage Group's P/E Ratio
Massimo Zanetti Beverage Group's P/E is 12.7 which is below average (19.1) in the IT market. The P/E reflects market pessimism that probably arises from the lack of recent EPS growth, paired with significant leverage.
When the market is wrong about a stock, it gives savvy investors an opportunity. If it is underestimating a company, investors can make money by buying and holding the shares until the market corrects itself. So this free visualization of the analyst consensus on future earnings could help you make the right decision about whether to buy, sell, or hold.
But note: Massimo Zanetti Beverage Group may not be the best stock to buy. So take a peek at this free list of interesting companies with strong recent earnings growth (and a P/E ratio below 20).
If you spot an error that warrants correction, please contact the editor at editorial-team@simplywallst.com. This article by Simply Wall St is general in nature. It does not constitute a recommendation to buy or sell any stock, and does not take account of your objectives, or your financial situation. Simply Wall St has no position in the stocks mentioned.
We aim to bring you long-term focused research analysis driven by fundamental data. Note that our analysis may not factor in the latest price-sensitive company announcements or qualitative material. Thank you for reading.

