
We're Hopeful That Oxford BioDynamics (LON:OBD) Will Use Its Cash Wisely

There's no doubt that money can be made by owning shares of unprofitable businesses. For example, although Amazon.com made losses for many years after listing, if you had bought and held the shares since 1999, you would have made a fortune. Having said that, unprofitable companies are risky because they could potentially burn through all their cash and become distressed.
So, the natural question for Oxford BioDynamics (LON:OBD) shareholders is whether they should be concerned by its rate of cash burn. For the purpose of this article, we'll define cash burn as the amount of cash the company is spending each year to fund its growth (also called its negative free cash flow). Let's start with an examination of the business' cash, relative to its cash burn.
Check out our latest analysis for Oxford BioDynamics
When Might Oxford BioDynamics Run Out Of Money?
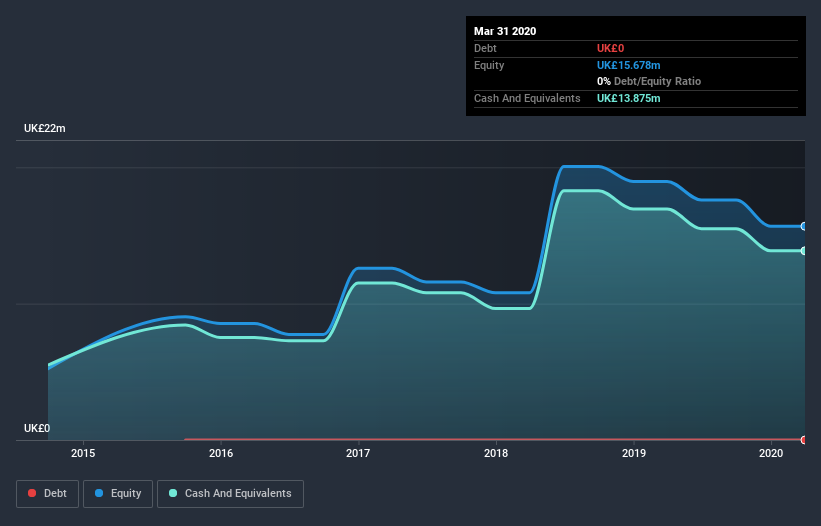
A company's cash runway is calculated by dividing its cash hoard by its cash burn. In March 2020, Oxford BioDynamics had UK£14m in cash, and was debt-free. Looking at the last year, the company burnt through UK£3.3m. Therefore, from March 2020 it had 4.2 years of cash runway. There's no doubt that this is a reassuringly long runway. You can see how its cash balance has changed over time in the image below.
How Is Oxford BioDynamics' Cash Burn Changing Over Time?
Although Oxford BioDynamics had revenue of UK£521k in the last twelve months, its operating revenue was only UK£521k in that time period. We don't think that's enough operating revenue for us to understand too much from revenue growth rates, since the company is growing off a low base. So we'll focus on the cash burn, today. With the cash burn rate up 27% in the last year, it seems that the company is ratcheting up investment in the business over time. That's not necessarily a bad thing, but investors should be mindful of the fact that will shorten the cash runway. Admittedly, we're a bit cautious of Oxford BioDynamics due to its lack of significant operating revenues. So we'd generally prefer stocks from this list of stocks that have analysts forecasting growth.
How Easily Can Oxford BioDynamics Raise Cash?
While Oxford BioDynamics does have a solid cash runway, its cash burn trajectory may have some shareholders thinking ahead to when the company may need to raise more cash. Issuing new shares, or taking on debt, are the most common ways for a listed company to raise more money for its business. Commonly, a business will sell new shares in itself to raise cash and drive growth. By comparing a company's annual cash burn to its total market capitalisation, we can estimate roughly how many shares it would have to issue in order to run the company for another year (at the same burn rate).
Oxford BioDynamics' cash burn of UK£3.3m is about 4.6% of its UK£71m market capitalisation. Given that is a rather small percentage, it would probably be really easy for the company to fund another year's growth by issuing some new shares to investors, or even by taking out a loan.
Is Oxford BioDynamics' Cash Burn A Worry?
As you can probably tell by now, we're not too worried about Oxford BioDynamics' cash burn. In particular, we think its cash runway stands out as evidence that the company is well on top of its spending. While its increasing cash burn wasn't great, the other factors mentioned in this article more than make up for weakness on that measure. Looking at all the measures in this article, together, we're not worried about its rate of cash burn; the company seems well on top of its medium-term spending needs. Separately, we looked at different risks affecting the company and spotted 4 warning signs for Oxford BioDynamics (of which 2 are a bit unpleasant!) you should know about.
Of course Oxford BioDynamics may not be the best stock to buy. So you may wish to see this free collection of companies boasting high return on equity, or this list of stocks that insiders are buying.
This article by Simply Wall St is general in nature. It does not constitute a recommendation to buy or sell any stock, and does not take account of your objectives, or your financial situation. We aim to bring you long-term focused analysis driven by fundamental data. Note that our analysis may not factor in the latest price-sensitive company announcements or qualitative material. Simply Wall St has no position in any stocks mentioned.
Have feedback on this article? Concerned about the content? Get in touch with us directly. Alternatively, email editorial-team@simplywallst.com.

