
Do You Like Umpqua Holdings Corporation (NASDAQ:UMPQ) At This P/E Ratio?

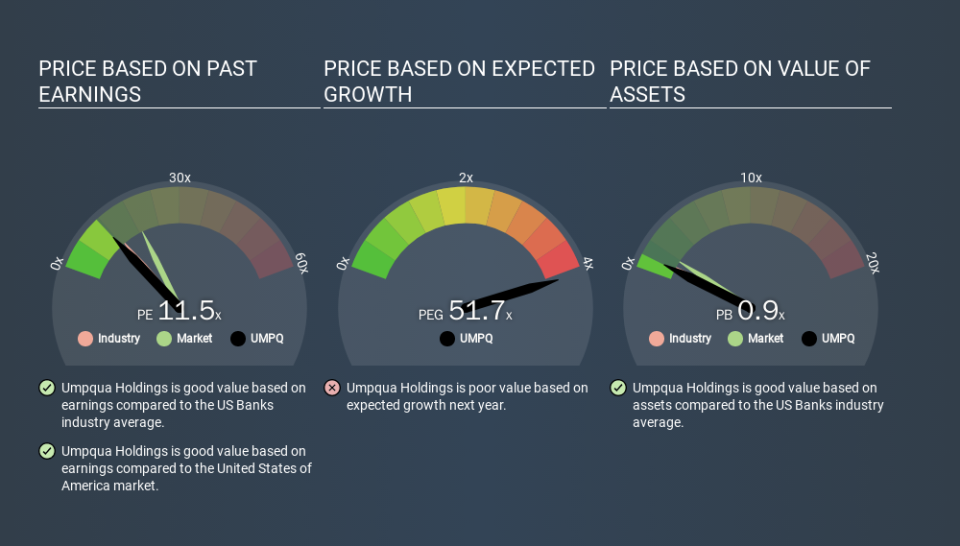
Today, we'll introduce the concept of the P/E ratio for those who are learning about investing. To keep it practical, we'll show how Umpqua Holdings Corporation's (NASDAQ:UMPQ) P/E ratio could help you assess the value on offer. Looking at earnings over the last twelve months, Umpqua Holdings has a P/E ratio of 11.51. In other words, at today's prices, investors are paying $11.51 for every $1 in prior year profit.
Check out our latest analysis for Umpqua Holdings
How Do You Calculate A P/E Ratio?
The formula for price to earnings is:
Price to Earnings Ratio = Share Price ÷ Earnings per Share (EPS)
Or for Umpqua Holdings:
P/E of 11.51 = USD18.31 ÷ USD1.59 (Based on the trailing twelve months to September 2019.)
Is A High Price-to-Earnings Ratio Good?
The higher the P/E ratio, the higher the price tag of a business, relative to its trailing earnings. That isn't a good or a bad thing on its own, but a high P/E means that buyers have a higher opinion of the business's prospects, relative to stocks with a lower P/E.
How Does Umpqua Holdings's P/E Ratio Compare To Its Peers?
The P/E ratio essentially measures market expectations of a company. The image below shows that Umpqua Holdings has a lower P/E than the average (12.8) P/E for companies in the banks industry.
Its relatively low P/E ratio indicates that Umpqua Holdings shareholders think it will struggle to do as well as other companies in its industry classification. Many investors like to buy stocks when the market is pessimistic about their prospects. You should delve deeper. I like to check if company insiders have been buying or selling.
How Growth Rates Impact P/E Ratios
Generally speaking the rate of earnings growth has a profound impact on a company's P/E multiple. When earnings grow, the 'E' increases, over time. And in that case, the P/E ratio itself will drop rather quickly. A lower P/E should indicate the stock is cheap relative to others -- and that may attract buyers.
Umpqua Holdings increased earnings per share by an impressive 13% over the last twelve months. And its annual EPS growth rate over 5 years is 16%. With that performance, you might expect an above average P/E ratio.
A Limitation: P/E Ratios Ignore Debt and Cash In The Bank
Don't forget that the P/E ratio considers market capitalization. So it won't reflect the advantage of cash, or disadvantage of debt. Hypothetically, a company could reduce its future P/E ratio by spending its cash (or taking on debt) to achieve higher earnings.
Such spending might be good or bad, overall, but the key point here is that you need to look at debt to understand the P/E ratio in context.
So What Does Umpqua Holdings's Balance Sheet Tell Us?
Umpqua Holdings's net debt is 16% of its market cap. That's enough debt to impact the P/E ratio a little; so keep it in mind if you're comparing it to companies without debt.
The Verdict On Umpqua Holdings's P/E Ratio
Umpqua Holdings trades on a P/E ratio of 11.5, which is below the US market average of 19.1. The EPS growth last year was strong, and debt levels are quite reasonable. The low P/E ratio suggests current market expectations are muted, implying these levels of growth will not continue.
Investors have an opportunity when market expectations about a stock are wrong. If the reality for a company is not as bad as the P/E ratio indicates, then the share price should increase as the market realizes this. So this free report on the analyst consensus forecasts could help you make a master move on this stock.
You might be able to find a better buy than Umpqua Holdings. If you want a selection of possible winners, check out this free list of interesting companies that trade on a P/E below 20 (but have proven they can grow earnings).
If you spot an error that warrants correction, please contact the editor at editorial-team@simplywallst.com. This article by Simply Wall St is general in nature. It does not constitute a recommendation to buy or sell any stock, and does not take account of your objectives, or your financial situation. Simply Wall St has no position in the stocks mentioned.
We aim to bring you long-term focused research analysis driven by fundamental data. Note that our analysis may not factor in the latest price-sensitive company announcements or qualitative material. Thank you for reading.

