TrueCar and ALG Forecast New and Used Vehicle Sales for September 2020 and the Third Quarter
TrueCar and ALG Forecast New and Used Vehicle Sales for September 2020 and the Third Quarter
Total Sales Change, Difference Year-over-Year
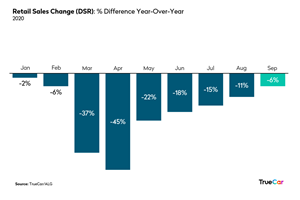
New vehicle sales continue to recover from April lows forecast as retail sales increase 27% quarter-over-quarter adjusted for selling days
Used vehicle sales forecast to be up year-over-year for fourth consecutive month
Average Transaction Prices are expected to increase 3.5% year-over-year
SANTA MONICA, Calif., Sept. 25, 2020 (GLOBE NEWSWIRE) -- TrueCar, Inc., and its ALG, Inc. subsidiary, project total new vehicle sales will reach 1,221,092 units in September 2020, down 12% from a year ago when adjusted for the same number of selling days. This month’s seasonally adjusted annualized rate (SAAR) for total light vehicle sales is an estimated 14.8 million units. Excluding fleet sales, TrueCar and ALG expect U.S. retail deliveries of new cars and light trucks to be 1,111,397 units, a decrease of 6% from a year ago when adjusted for the same number of selling days.
Average transaction prices (ATP) are projected to be up 3.5% or $1,223 from a year ago and up 0.4% or $156 from August 2020. TrueCar projects that U.S. revenue from new vehicle sales will reach more than $44 billion for September 2020, down 0.7% (based on a non-adjusted daily selling rate) from a year ago and down 7.1% from last month.
A photo accompanying this announcement is available at https://www.globenewswire.com/NewsRoom/AttachmentNg/101520bc-b933-4d1d-b298-054183cee4bd
“The automotive industry continues to perform better than initially expected with retail sales down just six percent compared with last year. We’re also seeing one of the best SAARs since March and used vehicles forecast to be up year-over-year for the fourth consecutive month,” said Eric Lyman, Chief Industry Analyst for ALG. “From a quarterly perspective, new vehicle retail sales are up 27% and used vehicle sales are up 26% quarter over quarter.”
“Large truck sales continue to spike as many consumers gravitate toward home improvement projects to enrich their home environment where they are also working and spending more of their leisure time,” added Lyman.
Additional Insights: (Forecast by ALG and TrueCar)
Total retail sales for September 2020 are expected to be down 6% from a year ago and down 4% from August 2020 when adjusted for the same number of selling days.
Fleet sales for September 2020 are expected to be down 45% from a year and up 0.2% from August 2020 when adjusted for the same number of selling days.
Total SAAR is expected to decrease 13% from a year ago from 17.1 million units to 14.8 million units.
Used vehicle sales for September 2020 are expected to reach 3.8 million, up 11% from a year ago and down 1% from August 2020.
The average interest rates on new vehicles are 5.7% and the average interest rates on used vehicles are 8.2%.
“Inventory levels are still low for certain popular models across brands as supply continues to play catch up from production pauses a few months ago. That being said, brands with a fresh lineup of diverse inventory of in-demand SUVs, such as Hyundai, are seeing some of the highest jumps in retail sales and average transaction prices year-over-year,” said Nick Woolard, Director of OEM Analytics at TrueCar.
“For this quarter, we are seeing certain automakers make significant increases in retail market share, which is difficult in such a competitive industry. Both Kia and Hyundai have jumped in retail share with successful launches into popular segments that are resonating with consumers,” added Woolard. “Electric vehicle maker Tesla has also made one of the biggest jumps in retail market share, thanks to its popular Model 3 and the newly released Model Y, which continue Tesla’s sales momentum.”
Quarterly Insights: (Forecast by ALG and TrueCar)
Total unit sales for Q3 are expected to be down 14% from last year when adjusted for the same number of selling days and up 28% from Q2 when adjusted for the same number of selling days.
Total retail sales for Q3 are expected to be down 10% from last year when adjusted for the same number of selling days and up 27% from Q2 when adjusted for the same number of selling days.
September 2020 forecasts for the 13 largest manufacturers by volume. For additional data visit the ALG Newsroom and TrueCar Newsroom.
Total Unit Sales
Manufacturer | Sep 2020 Forecast | Sep 2019 Actual | Aug 2020 Actual | YoY % Change | YoY % Change | MoM % Change | MoM % Change (Daily Selling Rate) | ||||
BMW | 26,325 | 31,100 | 25,235 | -15.4 | % | -22.1 | % | 4.3 | % | 8.5 | % |
Daimler | 25,031 | 32,002 | 23,966 | -21.8 | % | -28.0 | % | 4.4 | % | 8.6 | % |
FCA | 167,138 | 181,221 | 171,519 | -7.8 | % | -15.1 | % | -2.6 | % | 1.3 | % |
Ford | 180,050 | 173,333 | 184,781 | 3.9 | % | -4.4 | % | -2.6 | % | 1.3 | % |
GM | 204,004 | 209,658 | 218,845 | -2.7 | % | -10.5 | % | -6.8 | % | -3.1 | % |
Honda | 106,544 | 113,925 | 135,925 | -6.5 | % | -14.0 | % | -21.6 | % | -18.5 | % |
Hyundai | 56,916 | 53,510 | 59,721 | 6.4 | % | -2.1 | % | -4.7 | % | -0.9 | % |
Kia | 46,256 | 44,619 | 57,015 | 3.7 | % | -4.6 | % | -18.9 | % | -15.6 | % |
Nissan | 73,563 | 101,244 | 73,833 | -27.3 | % | -33.2 | % | -0.4 | % | 3.6 | % |
Subaru | 53,375 | 51,659 | 57,885 | 3.3 | % | -4.9 | % | -7.8 | % | -4.1 | % |
Tesla | 23,903 | 16,000 | 19,000 | 49.4 | % | 37.4 | % | 25.8 | % | 30.8 | % |
Toyota | 164,395 | 169,656 | 190,532 | -3.1 | % | -10.9 | % | -13.7 | % | -10.3 | % |
Volkswagen Group | 49,174 | 48,679 | 50,275 | 1.0 | % | -7.1 | % | -2.2 | % | 1.7 | % |
Industry | 1,221,092 | 1,272,583 | 1,319,682 | -4.0 | % | -11.7 | % | -7.5 | % | -3.8 | % |
Retail Unit Sales
Manufacturer | Sep 2020 Forecast | Sep 2019 Actual | Aug 2020 Actual | YoY % Change | YoY % Change | MoM % Change | MoM % Change (Daily Selling Rate) | ||||
BMW | 25,228 | 28,418 | 24,115 | -11.2 | % | -18.3 | % | 4.6 | % | 8.8 | % |
Daimler | 24,216 | 29,283 | 23,470 | -17.3 | % | -23.9 | % | 3.2 | % | 7.3 | % |
FCA | 140,147 | 134,697 | 150,584 | 4.0 | % | -4.3 | % | -6.9 | % | -3.2 | % |
Ford | 141,951 | 134,406 | 143,294 | 5.6 | % | -2.8 | % | -0.9 | % | 3.0 | % |
GM | 180,551 | 174,823 | 186,608 | 3.3 | % | -5.0 | % | -3.2 | % | 0.6 | % |
Honda | 106,099 | 113,035 | 135,269 | -6.1 | % | -13.6 | % | -21.6 | % | -18.4 | % |
Hyundai | 49,201 | 43,485 | 57,371 | 13.1 | % | 4.1 | % | -14.2 | % | -10.8 | % |
Kia | 45,279 | 40,178 | 55,480 | 12.7 | % | 3.7 | % | -18.4 | % | -15.1 | % |
Nissan | 70,757 | 73,228 | 68,560 | -3.4 | % | -11.1 | % | 3.2 | % | 7.3 | % |
Subaru | 52,549 | 50,676 | 56,677 | 3.7 | % | -4.6 | % | -7.3 | % | -3.6 | % |
Tesla | 23,891 | 16,000 | 18,986 | 49.3 | % | 37.4 | % | 25.8 | % | 30.9 | % |
Toyota | 159,017 | 162,470 | 184,787 | -2.1 | % | -10.0 | % | -13.9 | % | -10.5 | % |
Volkswagen Group | 48,967 | 48,000 | 49,828 | 2.0 | % | -6.1 | % | -1.7 | % | 2.2 | % |
Industry | 1,111,397 | 1,090,616 | 1,205,791 | 1.9 | % | -6.2 | % | -7.8 | % | -4.1 | % |
Fleet Unit Sales
Manufacturer | Sep 2020 Forecast | Sep 2019 Actual | Aug 2020 Actual | YoY % Change | YoY % Change | MoM % Change | MoM % Change (Daily Selling Rate) | ||||
BMW | 1,097 | 2,682 | 1,120 | -59.1 | % | -62.4 | % | -2.0 | % | 1.9 | % |
Daimler | 816 | 2,719 | 496 | -70.0 | % | -72.4 | % | 64.4 | % | 71.0 | % |
FCA | 26,991 | 46,524 | 20,935 | -42.0 | % | -46.6 | % | 28.9 | % | 34.1 | % |
Ford | 38,099 | 38,927 | 41,487 | -2.1 | % | -10.0 | % | -8.2 | % | -4.5 | % |
GM | 23,453 | 34,835 | 32,237 | -32.7 | % | -38.1 | % | -27.2 | % | -24.3 | % |
Honda | 445 | 890 | 656 | -50.0 | % | -54.0 | % | -32.1 | % | -29.4 | % |
Hyundai | 7,716 | 10,025 | 2,350 | -23.0 | % | -29.2 | % | 228.3 | % | 241.4 | % |
Kia | 977 | 4,441 | 1,535 | -78.0 | % | -79.8 | % | -36.4 | % | -33.8 | % |
Nissan | 2,806 | 28,016 | 5,273 | -90.0 | % | -90.8 | % | -46.8 | % | -44.7 | % |
Subaru | 826 | 983 | 1,208 | -16.0 | % | -22.7 | % | -31.6 | % | -28.9 | % |
Tesla | 12 | - | 14 | - | - | -15.6 | % | -12.2 | % | ||
Toyota | 5,379 | 7,186 | 5,745 | -25.1 | % | -31.1 | % | -6.4 | % | -2.6 | % |
Volkswagen Group | 207 | 679 | 447 | -69.6 | % | -72.0 | % | -53.7 | % | -51.9 | % |
Industry | 109,694 | 181,967 | 113,891 | -39.7 | % | -44.5 | % | -3.7 | % | 0.2 | % |
Fleet Penetration
Manufacturer | Sep 2020 Forecast | Sep 2019 Actual | Aug 2020 Actual | YoY % Change | MoM % Change | |||||
BMW | 4.2 | % | 8.6 | % | 4.4 | % | -51.7 | % | -6.1 | % |
Daimler | 3.3 | % | 8.5 | % | 2.1 | % | -61.6 | % | 57.4 | % |
FCA | 16.1 | % | 25.7 | % | 12.2 | % | -37.1 | % | 32.3 | % |
Ford | 21.2 | % | 22.5 | % | 22.5 | % | -5.8 | % | -5.8 | % |
GM | 11.5 | % | 16.6 | % | 14.7 | % | -30.8 | % | -22.0 | % |
Honda | 0.4 | % | 0.8 | % | 0.5 | % | -46.5 | % | -13.4 | % |
Hyundai | 13.6 | % | 18.7 | % | 3.9 | % | -27.6 | % | 244.4 | % |
Kia | 2.1 | % | 10.0 | % | 2.7 | % | -78.8 | % | -21.6 | % |
Nissan | 3.8 | % | 27.7 | % | 7.1 | % | -86.2 | % | -46.6 | % |
Subaru | 1.5 | % | 1.9 | % | 2.1 | % | -18.7 | % | -25.9 | % |
Tesla | 0.1 | % | 0.0 | % | 0.1 | % | - | -32.9 | % | |
Toyota | 3.3 | % | 4.2 | % | 3.0 | % | -22.8 | % | 8.5 | % |
Volkswagen Group | 0.4 | % | 1.4 | % | 0.9 | % | -69.9 | % | -52.7 | % |
Industry | 9.0 | % | 14.3 | % | 8.6 | % | -37.2 | % | 4.1 | % |
Total Market Share
Manufacturer | Sep 2020 Forecast | Sep 2019 Actual | Aug 2020 Actual | |||
BMW | 2.2 | % | 2.4 | % | 1.9 | % |
Daimler | 2.0 | % | 2.5 | % | 1.8 | % |
FCA | 13.7 | % | 14.2 | % | 13.0 | % |
Ford | 14.7 | % | 13.6 | % | 14.0 | % |
GM | 16.7 | % | 16.5 | % | 16.6 | % |
Honda | 8.7 | % | 9.0 | % | 10.3 | % |
Hyundai | 4.7 | % | 4.2 | % | 4.5 | % |
Kia | 3.8 | % | 3.5 | % | 4.3 | % |
Nissan | 6.0 | % | 8.0 | % | 5.6 | % |
Subaru | 4.4 | % | 4.1 | % | 4.4 | % |
Tesla | 2.0 | % | 1.3 | % | 1.4 | % |
Toyota | 13.5 | % | 13.3 | % | 14.4 | % |
Volkswagen Group | 4.0 | % | 3.8 | % | 3.8 | % |
Retail Market Share
Manufacturer | Sep 2020 Forecast | Sep 2019 Actual | Aug 2020 Actual | |||
BMW | 2.3 | % | 2.6 | % | 2.0 | % |
Daimler | 2.2 | % | 2.7 | % | 1.9 | % |
FCA | 12.6 | % | 12.4 | % | 12.5 | % |
Ford | 12.8 | % | 12.3 | % | 11.9 | % |
GM | 16.2 | % | 16.0 | % | 15.5 | % |
Honda | 9.5 | % | 10.4 | % | 11.2 | % |
Hyundai | 4.4 | % | 4.0 | % | 4.8 | % |
Kia | 4.1 | % | 3.7 | % | 4.6 | % |
Nissan | 6.4 | % | 6.7 | % | 5.7 | % |
Subaru | 4.7 | % | 4.6 | % | 4.7 | % |
Tesla | 2.1 | % | 1.5 | % | 1.6 | % |
Toyota | 14.3 | % | 14.9 | % | 15.3 | % |
Volkswagen Group | 4.4 | % | 4.4 | % | 4.1 | % |
Average Transaction Price (ATP)
Manufacturer | Aug 2020 Forecast | Aug 2019 Actual | Jul 2020 Actual | YOY | MOM | |||||
BMW | $ | 57,575 | $ | 54,440 | $ | 56,655 | 5.8 | % | 1.6 | % |
Daimler | $ | 58,441 | $ | 56,685 | $ | 59,482 | 3.1 | % | -1.8 | % |
FCA | $ | 43,011 | $ | 40,276 | $ | 41,981 | 6.8 | % | 2.5 | % |
Ford | $ | 43,469 | $ | 40,491 | $ | 42,707 | 7.4 | % | 1.8 | % |
GM | $ | 42,215 | $ | 41,577 | $ | 41,600 | 1.5 | % | 1.5 | % |
Honda | $ | 30,282 | $ | 29,214 | $ | 30,136 | 3.7 | % | 0.5 | % |
Hyundai | $ | 28,742 | $ | 25,682 | $ | 28,244 | 11.9 | % | 1.8 | % |
Kia | $ | 27,050 | $ | 25,784 | $ | 26,181 | 4.9 | % | 3.3 | % |
Nissan | $ | 28,937 | $ | 29,440 | $ | 28,666 | -1.7 | % | 0.9 | % |
Subaru | $ | 29,991 | $ | 29,534 | $ | 30,184 | 1.5 | % | -0.6 | % |
Toyota | $ | 33,726 | $ | 32,919 | $ | 34,003 | 2.4 | % | -0.8 | % |
Volkswagen Group | $ | 41,118 | $ | 39,261 | $ | 40,995 | 4.7 | % | 0.3 | % |
Industry | $ | 36,541 | $ | 35,319 | $ | 36,385 | 3.5 | % | 0.4 | % |
Incentive Spending
Manufacturer | Sep 2020 Forecast | Sep 2019 Actual | Aug 2020 Actual | YOY | MOM | ||||||
BMW | $ | 4,912 | $ | 6,019 | $ | 5,803 | -18.4 | % | -15.4 | % | |
Daimler | $ | 5,653 | $ | 5,369 | $ | 5,675 | 5.3 | % | -0.4 | % | |
FCA | $ | 5,172 | $ | 4,896 | $ | 5,060 | 5.6 | % | 2.2 | % | |
Ford | $ | 4,325 | $ | 4,606 | $ | 4,298 | -6.1 | % | 0.6 | % | |
GM | $ | 5,975 | $ | 5,124 | $ | 5,679 | 16.6 | % | 5.2 | % | |
Honda | $ | 1,941 | $ | 2,015 | $ | 2,618 | -3.7 | % | -25.8 | % | |
Hyundai | $ | 2,361 | $ | 2,732 | $ | 2,494 | -13.6 | % | -5.3 | % | |
Kia | $ | 3,009 | $ | 3,541 | $ | 3,779 | -15.0 | % | -20.4 | % | |
Nissan | $ | 4,158 | $ | 3,862 | $ | 4,816 | 7.7 | % | -13.7 | % | |
Subaru | $ | 1,627 | $ | 1,454 | $ | 1,747 | 11.9 | % | -6.9 | % | |
Toyota | $ | 2,666 | $ | 2,406 | $ | 2,720 | 10.8 | % | -2.0 | % | |
Volkswagen Group | $ | 4,082 | $ | 3,422 | $ | 4,339 | 19.3 | % | -5.9 | % | |
Industry | $ | 4,001 | $ | 3,802 | $ | 4,060 | 5.3 | % | -1.4 | % | |
Incentives as a Percentage of Average Transaction Price (ATP)
Manufacturer | Sep 2020 Forecast | Sep 2019 Actual | Aug 2020 Actual | YOY | MOM | ||||||
BMW | 8.5 | % | 11.1 | % | 10.2 | % | -22.8 | % | -16.7 | % | |
Daimler | 9.7 | % | 9.5 | % | 9.5 | % | 2.1 | % | 1.4 | % | |
FCA | 12.0 | % | 12.2 | % | 12.1 | % | -1.1 | % | -0.2 | % | |
Ford | 9.9 | % | 11.4 | % | 10.1 | % | -12.5 | % | -1.1 | % | |
GM | 14.2 | % | 12.3 | % | 13.7 | % | 14.9 | % | 3.7 | % | |
Honda | 6.4 | % | 6.9 | % | 8.7 | % | -7.1 | % | -26.2 | % | |
Hyundai | 8.2 | % | 10.6 | % | 8.8 | % | -22.8 | % | -7.0 | % | |
Kia | 11.1 | % | 13.7 | % | 14.4 | % | -19.0 | % | -22.9 | % | |
Nissan | 14.4 | % | 13.1 | % | 16.8 | % | 9.5 | % | -14.5 | % | |
Subaru | 5.4 | % | 4.9 | % | 5.8 | % | 10.2 | % | -6.3 | % | |
Toyota | 7.9 | % | 7.3 | % | 8.0 | % | 8.2 | % | -1.2 | % | |
Volkswagen Group | 9.9 | % | 8.7 | % | 10.6 | % | 13.9 | % | -6.2 | % | |
Industry | 11.0 | % | 10.8 | % | 11.2 | % | 1.7 | % | -1.9 | % | |
Quarterly Tables
Total Unit Sales, Quarterly
Manufacturer | Q3 2020 | Q3 2019 | Q2 2020 | YoY % Change | YoY % Change | QoQ % Change | QoQ % Change (Daily Selling Rate) | ||||
BMW | 74,048 | 86,157 | 53,029 | -14.1 | % | -15.2 | % | 39.6 | % | 39.6 | % |
Daimler | 75,847 | 89,766 | 58,917 | -15.5 | % | -16.6 | % | 28.7 | % | 28.7 | % |
FCA | 496,956 | 567,380 | 364,943 | -12.4 | % | -13.5 | % | 36.2 | % | 36.2 | % |
Ford | 539,809 | 576,006 | 432,317 | -6.3 | % | -7.5 | % | 24.9 | % | 24.9 | % |
GM | 627,605 | 735,642 | 489,264 | -14.7 | % | -15.8 | % | 28.3 | % | 28.3 | % |
Honda | 367,919 | 429,223 | 293,502 | -14.3 | % | -15.4 | % | 25.4 | % | 25.4 | % |
Hyundai | 175,571 | 177,953 | 145,307 | -1.3 | % | -2.6 | % | 20.8 | % | 20.8 | % |
Kia | 155,750 | 158,754 | 125,392 | -1.9 | % | -3.2 | % | 24.2 | % | 24.2 | % |
Nissan | 220,859 | 327,354 | 177,328 | -32.5 | % | -33.4 | % | 24.5 | % | 24.5 | % |
Subaru | 162,718 | 185,804 | 136,518 | -12.4 | % | -13.6 | % | 19.2 | % | 19.2 | % |
Tesla | 35,769 | 42,000 | 25,500 | -14.8 | % | -15.9 | % | 40.3 | % | 40.3 | % |
Toyota | 523,718 | 627,194 | 398,029 | -16.5 | % | -17.6 | % | 31.6 | % | 31.6 | % |
Volkswagen Group | 146,791 | 165,826 | 115,911 | -11.5 | % | -12.6 | % | 26.6 | % | 26.6 | % |
Industry | 3,768,194 | 4,318,068 | 2,936,014 | -12.7 | % | -13.9 | % | 28.3 | % | 28.3 | % |
Retail Unit Sales, Quarterly
Manufacturer | Q3 2020 | Q3 2019 | Q2 2020 | YoY % Change | YoY % Change | QoQ % Change | QoQ % Change (Daily Selling Rate) | ||||
BMW | 70,962 | 79,926 | 51,760 | -11.2 | % | -12.4 | % | 37.1 | % | 37.1 | % |
Daimler | 73,375 | 83,883 | 56,995 | -12.5 | % | -13.7 | % | 28.7 | % | 28.7 | % |
FCA | 416,702 | 443,710 | 322,158 | -6.1 | % | -7.3 | % | 29.3 | % | 29.3 | % |
Ford | 425,585 | 456,665 | 355,210 | -6.8 | % | -8.0 | % | 19.8 | % | 19.8 | % |
GM | 555,453 | 605,441 | 438,178 | -8.3 | % | -9.4 | % | 26.8 | % | 26.8 | % |
Honda | 366,382 | 425,956 | 290,488 | -14.0 | % | -15.1 | % | 26.1 | % | 26.1 | % |
Hyundai | 151,770 | 156,789 | 141,767 | -3.2 | % | -4.5 | % | 7.1 | % | 7.1 | % |
Kia | 152,460 | 143,077 | 122,218 | 6.6 | % | 5.2 | % | 24.7 | % | 24.7 | % |
Nissan | 212,434 | 245,038 | 151,149 | -13.3 | % | -14.4 | % | 40.5 | % | 40.5 | % |
Subaru | 160,201 | 181,937 | 133,709 | -11.9 | % | -13.1 | % | 19.8 | % | 19.8 | % |
Tesla | 58,673 | 42,000 | 25,248 | 39.7 | % | 37.9 | % | 132.4 | % | 132.4 | % |
Toyota | 506,583 | 600,433 | 386,069 | -15.6 | % | -16.7 | % | 31.2 | % | 31.2 | % |
Volkswagen Group | 146,174 | 159,560 | 114,221 | -8.4 | % | -9.6 | % | 28.0 | % | 28.0 | % |
Industry | 3,429,686 | 3,766,432 | 2,702,199 | -8.9 | % | -10.1 | % | 26.9 | % | 26.9 | % |
Total Market Share, Quarterly
Manufacturer | Q3 2020 | Q3 2019 | Q2 2020 | |||
BMW | 2.0 | % | 2.0 | % | 1.8 | % |
Daimler | 2.0 | % | 2.1 | % | 2.0 | % |
FCA | 13.2 | % | 13.1 | % | 12.4 | % |
Ford | 14.3 | % | 13.3 | % | 14.7 | % |
GM | 16.7 | % | 17.0 | % | 16.7 | % |
Honda | 9.8 | % | 9.9 | % | 10.0 | % |
Hyundai | 4.7 | % | 4.1 | % | 4.9 | % |
Kia | 4.1 | % | 3.7 | % | 4.3 | % |
Nissan | 5.9 | % | 7.6 | % | 6.0 | % |
Subaru | 4.3 | % | 4.3 | % | 4.6 | % |
Tesla | 0.9 | % | 1.0 | % | 0.9 | % |
Toyota | 13.9 | % | 14.5 | % | 13.6 | % |
Volkswagen Group | 3.9 | % | 3.8 | % | 3.9 | % |
Retail Market Share, Quarterly
Manufacturer | Q3 2020 | Q3 2019 | Q2 2020 | |||
BMW | 2.1 | % | 2.1 | % | 1.9 | % |
Daimler | 2.1 | % | 2.2 | % | 2.1 | % |
FCA | 12.1 | % | 11.8 | % | 11.9 | % |
Ford | 12.4 | % | 12.1 | % | 13.1 | % |
GM | 16.2 | % | 16.1 | % | 16.2 | % |
Honda | 10.7 | % | 11.3 | % | 10.8 | % |
Hyundai | 4.4 | % | 4.2 | % | 5.2 | % |
Kia | 4.4 | % | 3.8 | % | 4.5 | % |
Nissan | 6.2 | % | 6.5 | % | 5.6 | % |
Subaru | 4.7 | % | 4.8 | % | 4.9 | % |
Tesla | 1.7 | % | 1.1 | % | 0.9 | % |
Toyota | 14.8 | % | 15.9 | % | 14.3 | % |
Volkswagen Group | 4.3 | % | 4.2 | % | 4.2 | % |
(Note: This forecast is based solely on ALG's analysis of industry sales trends and conditions and is not a projection of TrueCar, Inc.’s operations.)
About ALG
Founded in 1964 and headquartered in Santa Monica, California, ALG is an industry authority on automotive residual value projections in both the United States and Canada. By analyzing nearly 2,500 vehicle trims each year to assess residual value, ALG provides auto industry and financial services clients with market industry insights, residual value forecasts, consulting and vehicle portfolio management and risk services. ALG is a wholly-owned subsidiary of TrueCar, Inc., a digital automotive marketplace that provides comprehensive pricing transparency about what other people paid for their cars. ALG has been publishing residual values for all cars, trucks and SUVs in the U.S. for over 55 years and in Canada since 1981.
About TrueCar
TrueCar is a leading automotive digital marketplace that enables car buyers to connect to our nationwide network of Certified Dealers. We are building the industry's most personalized and efficient car buying experience as we seek to bring more of the purchasing process online. Consumers who visit our marketplace will find a suite of vehicle discovery tools, price ratings and market context on new and used cars -- all with a clear view of what's a great deal. When they are ready, TrueCar will enable them to connect with a local Certified Dealer who shares in our belief that truth, transparency and fairness are the foundation of a great car buying experience. As part of our marketplace, TrueCar powers car-buying programs for over 250 leading brands, including AARP, Sam’s Club, and American Express. Nearly half of all new-car buyers engage with TrueCar powered sites, where they buy smarter and drive happier. TrueCar is headquartered in Santa Monica, California, with offices in Austin, Texas and Boston, Massachusetts.
For more information, please visit www.truecar.com, and follow us on Facebook or Twitter. TrueCar media line: +1-844-469-8442 (US toll-free) | Email: pr@truecar.com
TrueCar and ALG PR Contact:
Shadee Malekafzali
shadee@truecar.com
424.258.8694
