
Tang Palace (China) Holdings Limited's (HKG:1181) Fundamentals Look Pretty Strong: Could The Market Be Wrong About The Stock?

It is hard to get excited after looking at Tang Palace (China) Holdings' (HKG:1181) recent performance, when its stock has declined 36% over the past three months. However, a closer look at its sound financials might cause you to think again. Given that fundamentals usually drive long-term market outcomes, the company is worth looking at. Specifically, we decided to study Tang Palace (China) Holdings' ROE in this article.
Return on equity or ROE is a key measure used to assess how efficiently a company's management is utilizing the company's capital. In other words, it is a profitability ratio which measures the rate of return on the capital provided by the company's shareholders.
View our latest analysis for Tang Palace (China) Holdings
How Is ROE Calculated?
The formula for ROE is:
Return on Equity = Net Profit (from continuing operations) ÷ Shareholders' Equity
So, based on the above formula, the ROE for Tang Palace (China) Holdings is:
22% = CN¥93m ÷ CN¥429m (Based on the trailing twelve months to December 2019).
The 'return' is the yearly profit. One way to conceptualize this is that for each HK$1 of shareholders' capital it has, the company made HK$0.22 in profit.
Why Is ROE Important For Earnings Growth?
We have already established that ROE serves as an efficient profit-generating gauge for a company's future earnings. Based on how much of its profits the company chooses to reinvest or "retain", we are then able to evaluate a company's future ability to generate profits. Assuming all else is equal, companies that have both a higher return on equity and higher profit retention are usually the ones that have a higher growth rate when compared to companies that don't have the same features.
A Side By Side comparison of Tang Palace (China) Holdings' Earnings Growth And 22% ROE
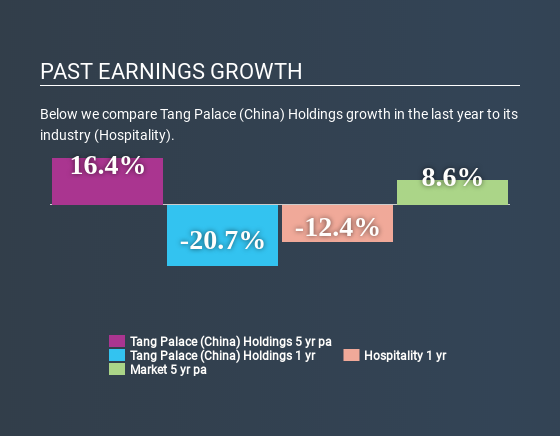
To start with, Tang Palace (China) Holdings' ROE looks acceptable. On comparing with the average industry ROE of 6.6% the company's ROE looks pretty remarkable. This certainly adds some context to Tang Palace (China) Holdings' decent 16% net income growth seen over the past five years.
Next, on comparing with the industry net income growth, we found that Tang Palace (China) Holdings' growth is quite high when compared to the industry average growth of 4.4% in the same period, which is great to see.
The basis for attaching value to a company is, to a great extent, tied to its earnings growth. What investors need to determine next is if the expected earnings growth, or the lack of it, is already built into the share price. Doing so will help them establish if the stock's future looks promising or ominous. One good indicator of expected earnings growth is the P/E ratio which determines the price the market is willing to pay for a stock based on its earnings prospects. So, you may want to check if Tang Palace (China) Holdings is trading on a high P/E or a low P/E, relative to its industry.
Is Tang Palace (China) Holdings Making Efficient Use Of Its Profits?
Tang Palace (China) Holdings has a significant three-year median payout ratio of 72%, meaning that it is left with only 28% to reinvest into its business. This implies that the company has been able to achieve decent earnings growth despite returning most of its profits to shareholders.
Moreover, Tang Palace (China) Holdings is determined to keep sharing its profits with shareholders which we infer from its long history of eight years of paying a dividend.
Summary
In total, we are pretty happy with Tang Palace (China) Holdings' performance. Especially the high ROE, Which has contributed to the impressive growth seen in earnings. Despite the company reinvesting only a small portion of its profits, it still has managed to grow its earnings so that is appreciable. Up till now, we've only made a short study of the company's growth data. So it may be worth checking this free detailed graph of Tang Palace (China) Holdings' past earnings, as well as revenue and cash flows to get a deeper insight into the company's performance.
Love or hate this article? Concerned about the content? Get in touch with us directly. Alternatively, email editorial-team@simplywallst.com.
This article by Simply Wall St is general in nature. It does not constitute a recommendation to buy or sell any stock, and does not take account of your objectives, or your financial situation. We aim to bring you long-term focused analysis driven by fundamental data. Note that our analysis may not factor in the latest price-sensitive company announcements or qualitative material. Simply Wall St has no position in any stocks mentioned. Thank you for reading.

