
Is Success Universe Group Limited's (HKG:487) P/E Ratio Really That Good?

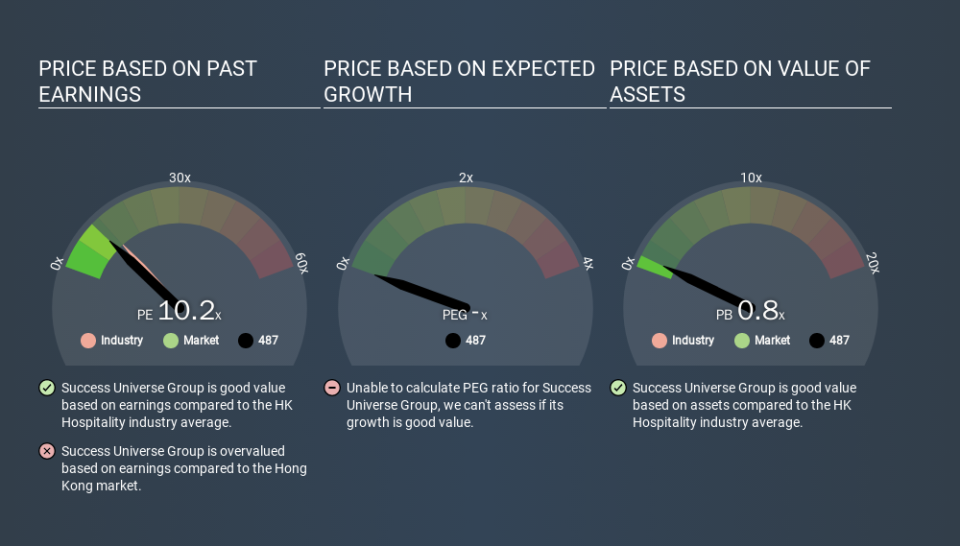
The goal of this article is to teach you how to use price to earnings ratios (P/E ratios). We'll show how you can use Success Universe Group Limited's (HKG:487) P/E ratio to inform your assessment of the investment opportunity. What is Success Universe Group's P/E ratio? Well, based on the last twelve months it is 10.24. That corresponds to an earnings yield of approximately 9.8%.
View our latest analysis for Success Universe Group
How Do I Calculate A Price To Earnings Ratio?
The formula for P/E is:
Price to Earnings Ratio = Price per Share ÷ Earnings per Share (EPS)
Or for Success Universe Group:
P/E of 10.24 = HKD0.18 ÷ HKD0.02 (Based on the year to June 2019.)
Is A High Price-to-Earnings Ratio Good?
A higher P/E ratio means that buyers have to pay a higher price for each HKD1 the company has earned over the last year. That isn't necessarily good or bad, but a high P/E implies relatively high expectations of what a company can achieve in the future.
Does Success Universe Group Have A Relatively High Or Low P/E For Its Industry?
We can get an indication of market expectations by looking at the P/E ratio. We can see in the image below that the average P/E (11.8) for companies in the hospitality industry is higher than Success Universe Group's P/E.
Success Universe Group's P/E tells us that market participants think it will not fare as well as its peers in the same industry. Many investors like to buy stocks when the market is pessimistic about their prospects. It is arguably worth checking if insiders are buying shares, because that might imply they believe the stock is undervalued.
How Growth Rates Impact P/E Ratios
Probably the most important factor in determining what P/E a company trades on is the earnings growth. Earnings growth means that in the future the 'E' will be higher. And in that case, the P/E ratio itself will drop rather quickly. So while a stock may look expensive based on past earnings, it could be cheap based on future earnings.
In the last year, Success Universe Group grew EPS like Taylor Swift grew her fan base back in 2010; the 108% gain was both fast and well deserved.
Don't Forget: The P/E Does Not Account For Debt or Bank Deposits
One drawback of using a P/E ratio is that it considers market capitalization, but not the balance sheet. So it won't reflect the advantage of cash, or disadvantage of debt. In theory, a company can lower its future P/E ratio by using cash or debt to invest in growth.
While growth expenditure doesn't always pay off, the point is that it is a good option to have; but one that the P/E ratio ignores.
Success Universe Group's Balance Sheet
Net debt totals 22% of Success Universe Group's market cap. It would probably deserve a higher P/E ratio if it was net cash, since it would have more options for growth.
The Verdict On Success Universe Group's P/E Ratio
Success Universe Group's P/E is 10.2 which is about average (10.1) in the HK market. Given it has reasonable debt levels, and grew earnings strongly last year, the P/E indicates the market has doubts this growth can be sustained.
Investors have an opportunity when market expectations about a stock are wrong. If the reality for a company is better than it expects, you can make money by buying and holding for the long term. Although we don't have analyst forecasts you might want to assess this data-rich visualization of earnings, revenue and cash flow.
You might be able to find a better buy than Success Universe Group. If you want a selection of possible winners, check out this free list of interesting companies that trade on a P/E below 20 (but have proven they can grow earnings).
If you spot an error that warrants correction, please contact the editor at editorial-team@simplywallst.com. This article by Simply Wall St is general in nature. It does not constitute a recommendation to buy or sell any stock, and does not take account of your objectives, or your financial situation. Simply Wall St has no position in the stocks mentioned.
We aim to bring you long-term focused research analysis driven by fundamental data. Note that our analysis may not factor in the latest price-sensitive company announcements or qualitative material. Thank you for reading.
