
Is Sopra Steria Group SA (EPA:SOP) Better Than Average At Deploying Capital?

Today we'll look at Sopra Steria Group SA (EPA:SOP) and reflect on its potential as an investment. To be precise, we'll consider its Return On Capital Employed (ROCE), as that will inform our view of the quality of the business.
Firstly, we'll go over how we calculate ROCE. Second, we'll look at its ROCE compared to similar companies. Finally, we'll look at how its current liabilities affect its ROCE.
What is Return On Capital Employed (ROCE)?
ROCE is a metric for evaluating how much pre-tax income (in percentage terms) a company earns on the capital invested in its business. In general, businesses with a higher ROCE are usually better quality. Ultimately, it is a useful but imperfect metric. Renowned investment researcher Michael Mauboussin has suggested that a high ROCE can indicate that 'one dollar invested in the company generates value of more than one dollar'.
So, How Do We Calculate ROCE?
The formula for calculating the return on capital employed is:
Return on Capital Employed = Earnings Before Interest and Tax (EBIT) ÷ (Total Assets - Current Liabilities)
Or for Sopra Steria Group:
0.12 = €283m ÷ (€4.4b - €2.1b) (Based on the trailing twelve months to June 2019.)
So, Sopra Steria Group has an ROCE of 12%.
See our latest analysis for Sopra Steria Group
Is Sopra Steria Group's ROCE Good?
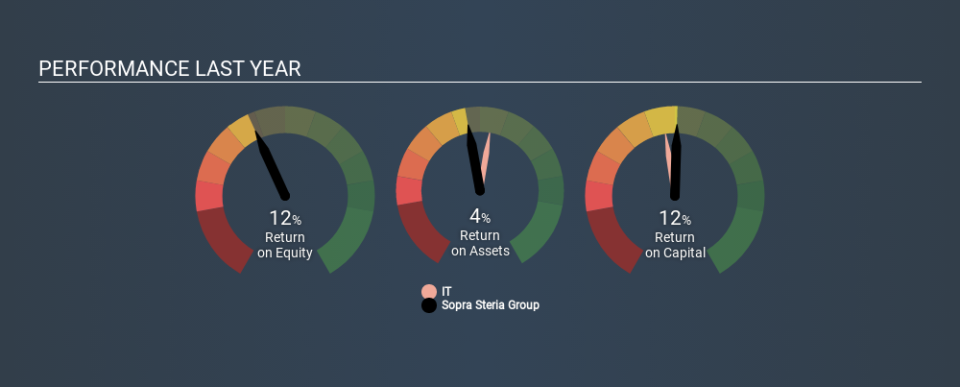
ROCE is commonly used for comparing the performance of similar businesses. It appears that Sopra Steria Group's ROCE is fairly close to the IT industry average of 13%. Regardless of where Sopra Steria Group sits next to its industry, its ROCE in absolute terms appears satisfactory, and this company could be worth a closer look.
The image below shows how Sopra Steria Group's ROCE compares to its industry, and you can click it to see more detail on its past growth.
When considering ROCE, bear in mind that it reflects the past and does not necessarily predict the future. ROCE can be deceptive for cyclical businesses, as returns can look incredible in boom times, and terribly low in downturns. ROCE is, after all, simply a snap shot of a single year. Future performance is what matters, and you can see analyst predictions in our free report on analyst forecasts for the company.
Do Sopra Steria Group's Current Liabilities Skew Its ROCE?
Current liabilities include invoices, such as supplier payments, short-term debt, or a tax bill, that need to be paid within 12 months. The ROCE equation subtracts current liabilities from capital employed, so a company with a lot of current liabilities appears to have less capital employed, and a higher ROCE than otherwise. To check the impact of this, we calculate if a company has high current liabilities relative to its total assets.
Sopra Steria Group has total assets of €4.4b and current liabilities of €2.1b. Therefore its current liabilities are equivalent to approximately 48% of its total assets. Sopra Steria Group has a middling amount of current liabilities, increasing its ROCE somewhat.
Our Take On Sopra Steria Group's ROCE
While its ROCE looks good, it's worth remembering that the current liabilities are making the business look better. There might be better investments than Sopra Steria Group out there, but you will have to work hard to find them . These promising businesses with rapidly growing earnings might be right up your alley.
I will like Sopra Steria Group better if I see some big insider buys. While we wait, check out this free list of growing companies with considerable, recent, insider buying.
If you spot an error that warrants correction, please contact the editor at editorial-team@simplywallst.com. This article by Simply Wall St is general in nature. It does not constitute a recommendation to buy or sell any stock, and does not take account of your objectives, or your financial situation. Simply Wall St has no position in the stocks mentioned.
We aim to bring you long-term focused research analysis driven by fundamental data. Note that our analysis may not factor in the latest price-sensitive company announcements or qualitative material. Thank you for reading.

