
A Sliding Share Price Has Us Looking At Hypebeast Limited's (HKG:150) P/E Ratio

To the annoyance of some shareholders, Hypebeast (HKG:150) shares are down a considerable 32% in the last month. Even longer term holders have taken a real hit with the stock declining 13% in the last year.
All else being equal, a share price drop should make a stock more attractive to potential investors. While the market sentiment towards a stock is very changeable, in the long run, the share price will tend to move in the same direction as earnings per share. The implication here is that long term investors have an opportunity when expectations of a company are too low. Perhaps the simplest way to get a read on investors' expectations of a business is to look at its Price to Earnings Ratio (PE Ratio). Investors have optimistic expectations of companies with higher P/E ratios, compared to companies with lower P/E ratios.
Check out our latest analysis for Hypebeast
Does Hypebeast Have A Relatively High Or Low P/E For Its Industry?
Hypebeast's P/E of 19.62 indicates some degree of optimism towards the stock. You can see in the image below that the average P/E (10.9) for companies in the interactive media and services industry is lower than Hypebeast's P/E.
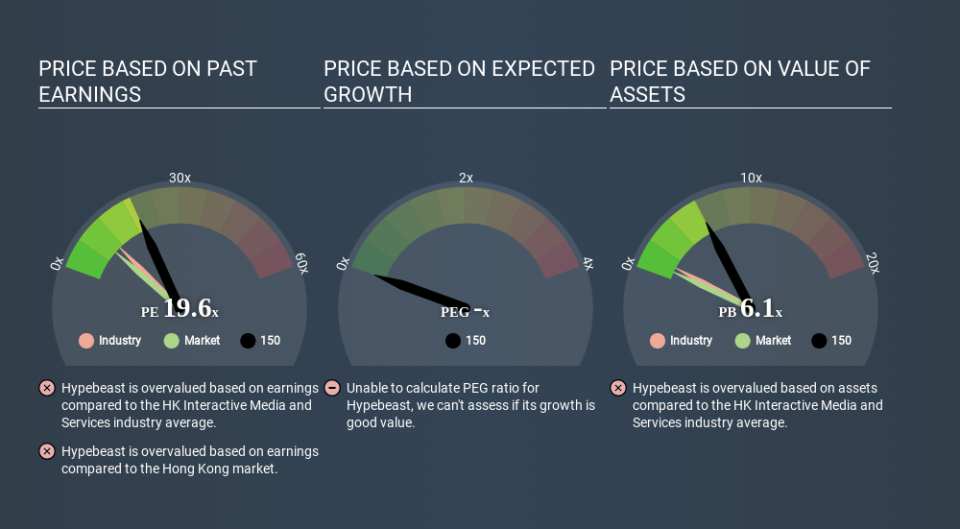
Its relatively high P/E ratio indicates that Hypebeast shareholders think it will perform better than other companies in its industry classification. The market is optimistic about the future, but that doesn't guarantee future growth. So investors should always consider the P/E ratio alongside other factors, such as whether company directors have been buying shares.
How Growth Rates Impact P/E Ratios
Earnings growth rates have a big influence on P/E ratios. That's because companies that grow earnings per share quickly will rapidly increase the 'E' in the equation. Therefore, even if you pay a high multiple of earnings now, that multiple will become lower in the future. So while a stock may look expensive based on past earnings, it could be cheap based on future earnings.
Hypebeast's 53% EPS improvement over the last year was like bamboo growth after rain; rapid and impressive. The sweetener is that the annual five year growth rate of 45% is also impressive. With that kind of growth rate we would generally expect a high P/E ratio.
A Limitation: P/E Ratios Ignore Debt and Cash In The Bank
One drawback of using a P/E ratio is that it considers market capitalization, but not the balance sheet. That means it doesn't take debt or cash into account. In theory, a company can lower its future P/E ratio by using cash or debt to invest in growth.
Spending on growth might be good or bad a few years later, but the point is that the P/E ratio does not account for the option (or lack thereof).
So What Does Hypebeast's Balance Sheet Tell Us?
The extra options and safety that comes with Hypebeast's HK$14m net cash position means that it deserves a higher P/E than it would if it had a lot of net debt.
The Bottom Line On Hypebeast's P/E Ratio
Hypebeast has a P/E of 19.6. That's higher than the average in its market, which is 9.1. The excess cash it carries is the gravy on top its fast EPS growth. So based on this analysis we'd expect Hypebeast to have a high P/E ratio. What can be absolutely certain is that the market has become significantly less optimistic about Hypebeast over the last month, with the P/E ratio falling from 29.0 back then to 19.6 today. For those who prefer to invest with the flow of momentum, that might be a bad sign, but for a contrarian, it may signal opportunity.
Investors have an opportunity when market expectations about a stock are wrong. If the reality for a company is better than it expects, you can make money by buying and holding for the long term. We don't have analyst forecasts, but you might want to assess this data-rich visualization of earnings, revenue and cash flow.
Of course, you might find a fantastic investment by looking at a few good candidates. So take a peek at this free list of companies with modest (or no) debt, trading on a P/E below 20.
If you spot an error that warrants correction, please contact the editor at editorial-team@simplywallst.com. This article by Simply Wall St is general in nature. It does not constitute a recommendation to buy or sell any stock, and does not take account of your objectives, or your financial situation. Simply Wall St has no position in the stocks mentioned.
We aim to bring you long-term focused research analysis driven by fundamental data. Note that our analysis may not factor in the latest price-sensitive company announcements or qualitative material. Thank you for reading.
