
Do You Like Selvaag Bolig ASA (OB:SBO) At This P/E Ratio?

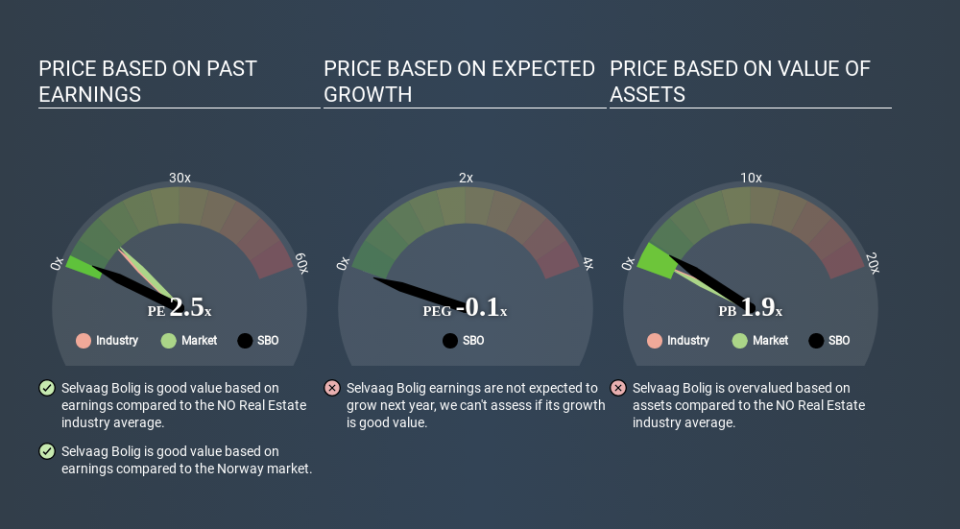
This article is for investors who would like to improve their understanding of price to earnings ratios (P/E ratios). We'll look at Selvaag Bolig ASA's (OB:SBO) P/E ratio and reflect on what it tells us about the company's share price. Selvaag Bolig has a P/E ratio of 2.50, based on the last twelve months. In other words, at today's prices, investors are paying NOK2.50 for every NOK1 in prior year profit.
Check out our latest analysis for Selvaag Bolig
How Do I Calculate A Price To Earnings Ratio?
The formula for price to earnings is:
Price to Earnings Ratio = Price per Share ÷ Earnings per Share (EPS)
Or for Selvaag Bolig:
P/E of 2.50 = NOK48.700 ÷ NOK19.443 (Based on the year to March 2020.)
(Note: the above calculation results may not be precise due to rounding.)
Is A High Price-to-Earnings Ratio Good?
The higher the P/E ratio, the higher the price tag of a business, relative to its trailing earnings. That isn't necessarily good or bad, but a high P/E implies relatively high expectations of what a company can achieve in the future.
Does Selvaag Bolig Have A Relatively High Or Low P/E For Its Industry?
One good way to get a quick read on what market participants expect of a company is to look at its P/E ratio. We can see in the image below that the average P/E (10.5) for companies in the real estate industry is higher than Selvaag Bolig's P/E.
This suggests that market participants think Selvaag Bolig will underperform other companies in its industry. Many investors like to buy stocks when the market is pessimistic about their prospects. If you consider the stock interesting, further research is recommended. For example, I often monitor director buying and selling.
How Growth Rates Impact P/E Ratios
Probably the most important factor in determining what P/E a company trades on is the earnings growth. When earnings grow, the 'E' increases, over time. That means unless the share price increases, the P/E will reduce in a few years. A lower P/E should indicate the stock is cheap relative to others -- and that may attract buyers.
Selvaag Bolig's earnings made like a rocket, taking off 248% last year. The cherry on top is that the five year growth rate was an impressive 41% per year. So I'd be surprised if the P/E ratio was not above average.
Remember: P/E Ratios Don't Consider The Balance Sheet
It's important to note that the P/E ratio considers the market capitalization, not the enterprise value. Thus, the metric does not reflect cash or debt held by the company. In theory, a company can lower its future P/E ratio by using cash or debt to invest in growth.
Such spending might be good or bad, overall, but the key point here is that you need to look at debt to understand the P/E ratio in context.
Selvaag Bolig's Balance Sheet
Net debt is 38% of Selvaag Bolig's market cap. While that's enough to warrant consideration, it doesn't really concern us.
The Verdict On Selvaag Bolig's P/E Ratio
Selvaag Bolig's P/E is 2.5 which is below average (11.6) in the NO market. The company does have a little debt, and EPS growth was good last year. The low P/E ratio suggests current market expectations are muted, implying these levels of growth will not continue.
Investors should be looking to buy stocks that the market is wrong about. As value investor Benjamin Graham famously said, 'In the short run, the market is a voting machine but in the long run, it is a weighing machine. So this free visual report on analyst forecasts could hold the key to an excellent investment decision.
Of course you might be able to find a better stock than Selvaag Bolig. So you may wish to see this free collection of other companies that have grown earnings strongly.
Love or hate this article? Concerned about the content? Get in touch with us directly. Alternatively, email editorial-team@simplywallst.com.
This article by Simply Wall St is general in nature. It does not constitute a recommendation to buy or sell any stock, and does not take account of your objectives, or your financial situation. We aim to bring you long-term focused analysis driven by fundamental data. Note that our analysis may not factor in the latest price-sensitive company announcements or qualitative material. Simply Wall St has no position in any stocks mentioned. Thank you for reading.

