
A Rising Share Price Has Us Looking Closely At Gullewa Limited's (ASX:GUL) P/E Ratio

Gullewa (ASX:GUL) shares have continued recent momentum with a 38% gain in the last month alone. The full year gain of 38% is pretty reasonable, too.
Assuming no other changes, a sharply higher share price makes a stock less attractive to potential buyers. While the market sentiment towards a stock is very changeable, in the long run, the share price will tend to move in the same direction as earnings per share. The implication here is that deep value investors might steer clear when expectations of a company are too high. Perhaps the simplest way to get a read on investors' expectations of a business is to look at its Price to Earnings Ratio (PE Ratio). A high P/E implies that investors have high expectations of what a company can achieve compared to a company with a low P/E ratio.
Check out our latest analysis for Gullewa
Does Gullewa Have A Relatively High Or Low P/E For Its Industry?
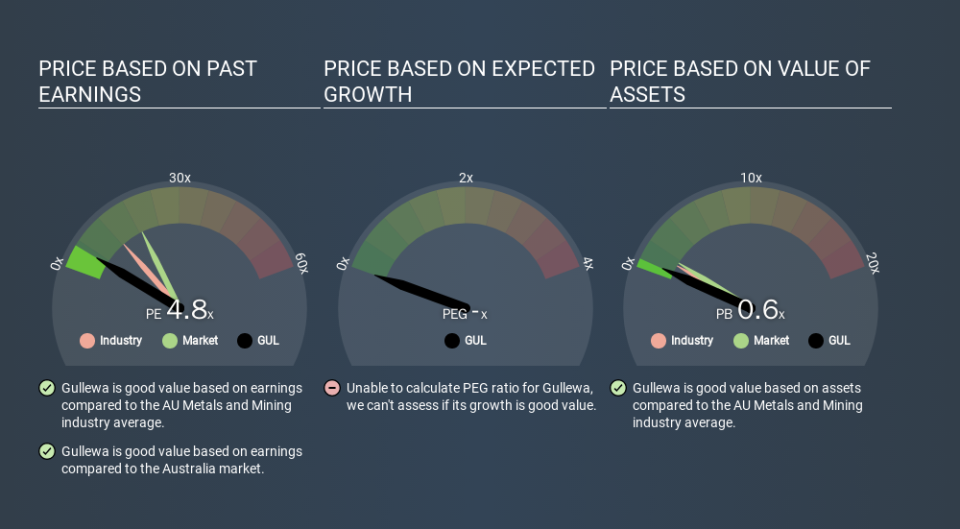
We can tell from its P/E ratio of 6.03 that sentiment around Gullewa isn't particularly high. We can see in the image below that the average P/E (12.4) for companies in the metals and mining industry is higher than Gullewa's P/E.
Gullewa's P/E tells us that market participants think it will not fare as well as its peers in the same industry. Since the market seems unimpressed with Gullewa, it's quite possible it could surprise on the upside. If you consider the stock interesting, further research is recommended. For example, I often monitor director buying and selling.
How Growth Rates Impact P/E Ratios
P/E ratios primarily reflect market expectations around earnings growth rates. When earnings grow, the 'E' increases, over time. That means unless the share price increases, the P/E will reduce in a few years. And as that P/E ratio drops, the company will look cheap, unless its share price increases.
Gullewa shrunk earnings per share by 8.5% last year.
A Limitation: P/E Ratios Ignore Debt and Cash In The Bank
Don't forget that the P/E ratio considers market capitalization. So it won't reflect the advantage of cash, or disadvantage of debt. Theoretically, a business can improve its earnings (and produce a lower P/E in the future) by investing in growth. That means taking on debt (or spending its cash).
While growth expenditure doesn't always pay off, the point is that it is a good option to have; but one that the P/E ratio ignores.
So What Does Gullewa's Balance Sheet Tell Us?
With net cash of AU$1.4m, Gullewa has a very strong balance sheet, which may be important for its business. Having said that, at 23% of its market capitalization the cash hoard would contribute towards a higher P/E ratio.
The Verdict On Gullewa's P/E Ratio
Gullewa has a P/E of 6.0. That's below the average in the AU market, which is 18.8. The recent drop in earnings per share would make investors cautious, the healthy balance sheet means the company retains potential for future growth. If that occurs, the current low P/E could prove to be temporary. What is very clear is that the market has become less pessimistic about Gullewa over the last month, with the P/E ratio rising from 4.4 back then to 6.0 today. For those who like to invest in turnarounds, that might mean it's time to put the stock on a watchlist, or research it. But others might consider the opportunity to have passed.
Investors should be looking to buy stocks that the market is wrong about. As value investor Benjamin Graham famously said, 'In the short run, the market is a voting machine but in the long run, it is a weighing machine. We don't have analyst forecasts, but shareholders might want to examine this detailed historical graph of earnings, revenue and cash flow.
You might be able to find a better buy than Gullewa. If you want a selection of possible winners, check out this free list of interesting companies that trade on a P/E below 20 (but have proven they can grow earnings).
If you spot an error that warrants correction, please contact the editor at editorial-team@simplywallst.com. This article by Simply Wall St is general in nature. It does not constitute a recommendation to buy or sell any stock, and does not take account of your objectives, or your financial situation. Simply Wall St has no position in the stocks mentioned.
We aim to bring you long-term focused research analysis driven by fundamental data. Note that our analysis may not factor in the latest price-sensitive company announcements or qualitative material. Thank you for reading.

