
Read This Before You Buy United Overseas Australia Limited (ASX:UOS) Because Of Its P/E Ratio

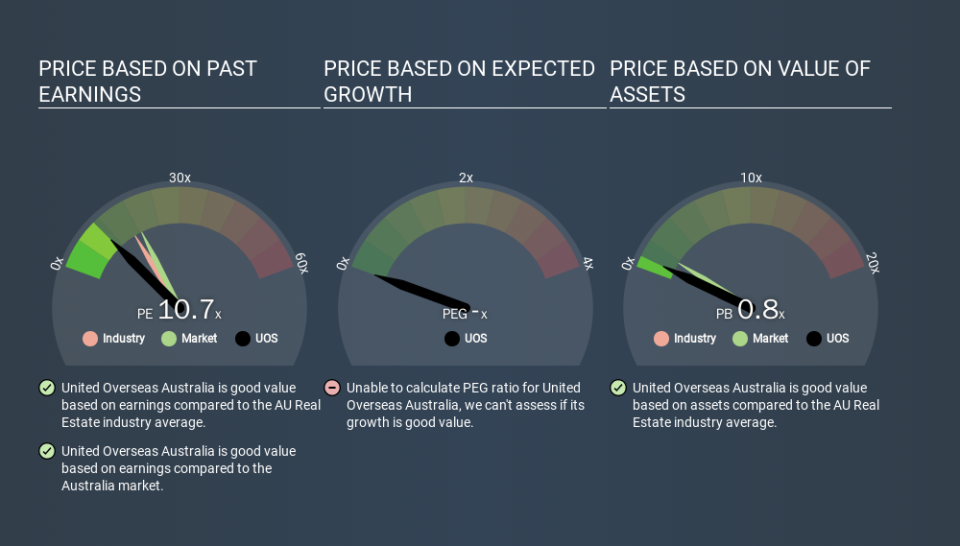
The goal of this article is to teach you how to use price to earnings ratios (P/E ratios). To keep it practical, we'll show how United Overseas Australia Limited's (ASX:UOS) P/E ratio could help you assess the value on offer. Based on the last twelve months, United Overseas Australia's P/E ratio is 10.68. In other words, at today's prices, investors are paying A$10.68 for every A$1 in prior year profit.
View our latest analysis for United Overseas Australia
How Do You Calculate A P/E Ratio?
The formula for price to earnings is:
Price to Earnings Ratio = Price per Share ÷ Earnings per Share (EPS)
Or for United Overseas Australia:
P/E of 10.68 = AUD0.80 ÷ AUD0.07 (Based on the trailing twelve months to June 2019.)
Is A High Price-to-Earnings Ratio Good?
The higher the P/E ratio, the higher the price tag of a business, relative to its trailing earnings. That is not a good or a bad thing per se, but a high P/E does imply buyers are optimistic about the future.
Does United Overseas Australia Have A Relatively High Or Low P/E For Its Industry?
We can get an indication of market expectations by looking at the P/E ratio. We can see in the image below that the average P/E (16.4) for companies in the real estate industry is higher than United Overseas Australia's P/E.
United Overseas Australia's P/E tells us that market participants think it will not fare as well as its peers in the same industry. Many investors like to buy stocks when the market is pessimistic about their prospects. You should delve deeper. I like to check if company insiders have been buying or selling.
How Growth Rates Impact P/E Ratios
If earnings fall then in the future the 'E' will be lower. That means unless the share price falls, the P/E will increase in a few years. Then, a higher P/E might scare off shareholders, pushing the share price down.
United Overseas Australia saw earnings per share decrease by 5.8% last year. But it has grown its earnings per share by 2.1% per year over the last five years. And EPS is down 12% a year, over the last 3 years. So we might expect a relatively low P/E.
Remember: P/E Ratios Don't Consider The Balance Sheet
One drawback of using a P/E ratio is that it considers market capitalization, but not the balance sheet. Thus, the metric does not reflect cash or debt held by the company. Hypothetically, a company could reduce its future P/E ratio by spending its cash (or taking on debt) to achieve higher earnings.
Spending on growth might be good or bad a few years later, but the point is that the P/E ratio does not account for the option (or lack thereof).
How Does United Overseas Australia's Debt Impact Its P/E Ratio?
United Overseas Australia has net cash of AU$273m. This is fairly high at 23% of its market capitalization. That might mean balance sheet strength is important to the business, but should also help push the P/E a bit higher than it would otherwise be.
The Bottom Line On United Overseas Australia's P/E Ratio
United Overseas Australia's P/E is 10.7 which is below average (18.6) in the AU market. The recent drop in earnings per share would make investors cautious, but the net cash position means the company has time to improve: if so, the low P/E could be an opportunity.
Investors should be looking to buy stocks that the market is wrong about. If the reality for a company is not as bad as the P/E ratio indicates, then the share price should increase as the market realizes this. Although we don't have analyst forecasts shareholders might want to examine this detailed historical graph of earnings, revenue and cash flow.
Of course, you might find a fantastic investment by looking at a few good candidates. So take a peek at this free list of companies with modest (or no) debt, trading on a P/E below 20.
If you spot an error that warrants correction, please contact the editor at editorial-team@simplywallst.com. This article by Simply Wall St is general in nature. It does not constitute a recommendation to buy or sell any stock, and does not take account of your objectives, or your financial situation. Simply Wall St has no position in the stocks mentioned.
We aim to bring you long-term focused research analysis driven by fundamental data. Note that our analysis may not factor in the latest price-sensitive company announcements or qualitative material. Thank you for reading.

