
Read This Before You Buy Sinic Holdings (Group) Company Limited (HKG:2103) Because Of Its P/E Ratio

The goal of this article is to teach you how to use price to earnings ratios (P/E ratios). To keep it practical, we'll show how Sinic Holdings (Group) Company Limited's (HKG:2103) P/E ratio could help you assess the value on offer. Looking at earnings over the last twelve months, Sinic Holdings (Group) has a P/E ratio of 5.86. In other words, at today's prices, investors are paying HK$5.86 for every HK$1 in prior year profit.
See our latest analysis for Sinic Holdings (Group)
How Do I Calculate Sinic Holdings (Group)'s Price To Earnings Ratio?
The formula for price to earnings is:
Price to Earnings Ratio = Share Price (in reporting currency) ÷ Earnings per Share (EPS)
Or for Sinic Holdings (Group):
P/E of 5.86 = CN¥3.737 ÷ CN¥0.638 (Based on the year to December 2019.)
(Note: the above calculation uses the share price in the reporting currency, namely CNY and the calculation results may not be precise due to rounding.)
Is A High P/E Ratio Good?
The higher the P/E ratio, the higher the price tag of a business, relative to its trailing earnings. All else being equal, it's better to pay a low price -- but as Warren Buffett said, 'It's far better to buy a wonderful company at a fair price than a fair company at a wonderful price'.
Does Sinic Holdings (Group) Have A Relatively High Or Low P/E For Its Industry?
We can get an indication of market expectations by looking at the P/E ratio. If you look at the image below, you can see Sinic Holdings (Group) has a lower P/E than the average (6.5) in the real estate industry classification.
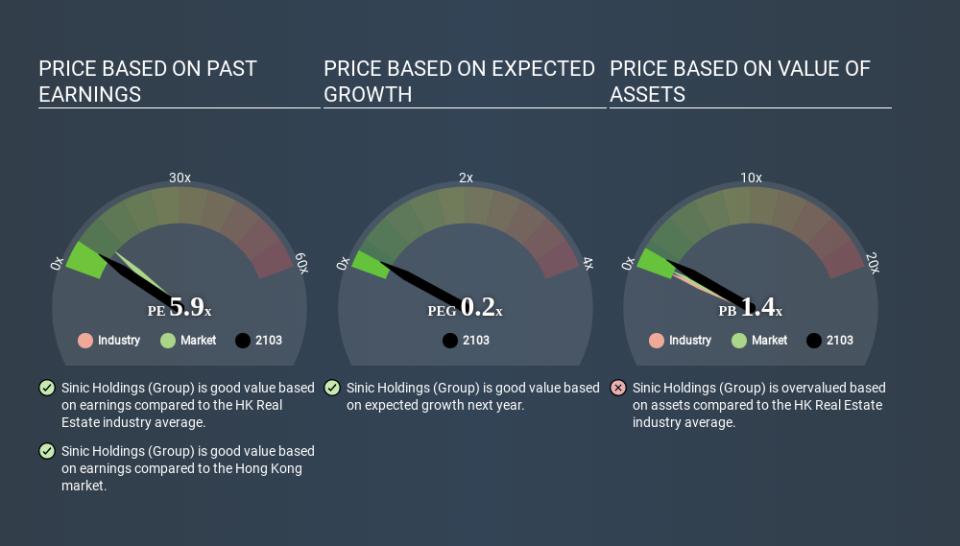
This suggests that market participants think Sinic Holdings (Group) will underperform other companies in its industry. While current expectations are low, the stock could be undervalued if the situation is better than the market assumes. You should delve deeper. I like to check if company insiders have been buying or selling.
How Growth Rates Impact P/E Ratios
P/E ratios primarily reflect market expectations around earnings growth rates. If earnings are growing quickly, then the 'E' in the equation will increase faster than it would otherwise. That means even if the current P/E is high, it will reduce over time if the share price stays flat. So while a stock may look expensive based on past earnings, it could be cheap based on future earnings.
Sinic Holdings (Group) saw earnings per share decrease by 54% last year.
A Limitation: P/E Ratios Ignore Debt and Cash In The Bank
One drawback of using a P/E ratio is that it considers market capitalization, but not the balance sheet. That means it doesn't take debt or cash into account. In theory, a company can lower its future P/E ratio by using cash or debt to invest in growth.
Such expenditure might be good or bad, in the long term, but the point here is that the balance sheet is not reflected by this ratio.
Is Debt Impacting Sinic Holdings (Group)'s P/E?
Sinic Holdings (Group)'s net debt is considerable, at 118% of its market cap. This level of debt justifies a relatively low P/E, so remain cognizant of the debt, if you're comparing it to other stocks.
The Bottom Line On Sinic Holdings (Group)'s P/E Ratio
Sinic Holdings (Group) trades on a P/E ratio of 5.9, which is below the HK market average of 9.1. Given meaningful debt, and a lack of recent growth, the market looks to be extrapolating this recent performance; reflecting low expectations for the future.
Investors should be looking to buy stocks that the market is wrong about. If it is underestimating a company, investors can make money by buying and holding the shares until the market corrects itself. So this free report on the analyst consensus forecasts could help you make a master move on this stock.
Of course you might be able to find a better stock than Sinic Holdings (Group). So you may wish to see this free collection of other companies that have grown earnings strongly.
If you spot an error that warrants correction, please contact the editor at editorial-team@simplywallst.com. This article by Simply Wall St is general in nature. It does not constitute a recommendation to buy or sell any stock, and does not take account of your objectives, or your financial situation. Simply Wall St has no position in the stocks mentioned.
We aim to bring you long-term focused research analysis driven by fundamental data. Note that our analysis may not factor in the latest price-sensitive company announcements or qualitative material. Thank you for reading.

