
Read This Before You Buy FIT Hon Teng Limited (HKG:6088) Because Of Its P/E Ratio

This article is for investors who would like to improve their understanding of price to earnings ratios (P/E ratios). To keep it practical, we'll show how FIT Hon Teng Limited's (HKG:6088) P/E ratio could help you assess the value on offer. FIT Hon Teng has a price to earnings ratio of 9.16, based on the last twelve months. That is equivalent to an earnings yield of about 10.9%.
View our latest analysis for FIT Hon Teng
How Do You Calculate FIT Hon Teng's P/E Ratio?
The formula for P/E is:
Price to Earnings Ratio = Price per Share (in the reporting currency) ÷ Earnings per Share (EPS)
Or for FIT Hon Teng:
P/E of 9.16 = USD0.32 (Note: this is the share price in the reporting currency, namely, USD ) ÷ USD0.03 (Based on the year to June 2019.)
Is A High Price-to-Earnings Ratio Good?
A higher P/E ratio means that buyers have to pay a higher price for each USD1 the company has earned over the last year. All else being equal, it's better to pay a low price -- but as Warren Buffett said, 'It's far better to buy a wonderful company at a fair price than a fair company at a wonderful price'.
Does FIT Hon Teng Have A Relatively High Or Low P/E For Its Industry?
One good way to get a quick read on what market participants expect of a company is to look at its P/E ratio. You can see in the image below that the average P/E (9.2) for companies in the electronic industry is roughly the same as FIT Hon Teng's P/E.
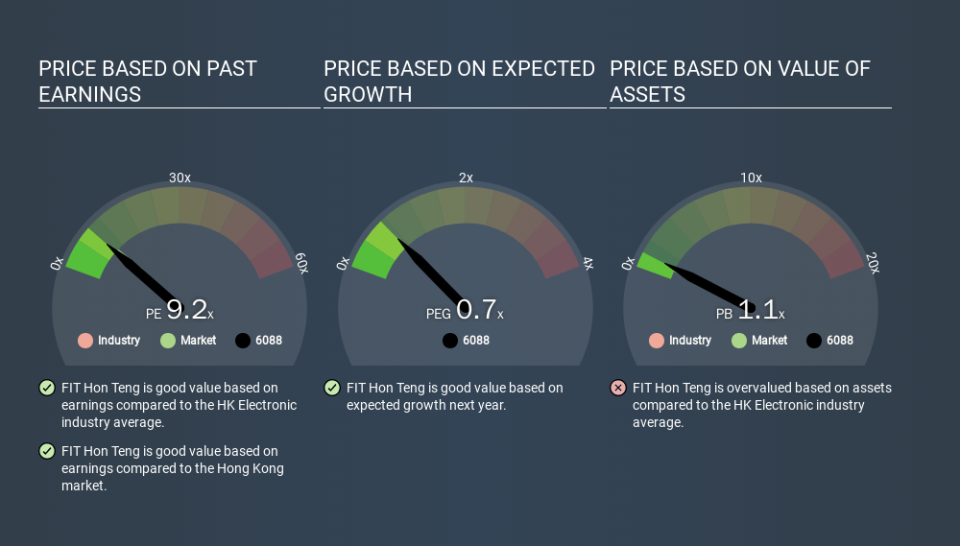
That indicates that the market expects FIT Hon Teng will perform roughly in line with other companies in its industry. So if FIT Hon Teng actually outperforms its peers going forward, that should be a positive for the share price. I would further inform my view by checking insider buying and selling., among other things.
How Growth Rates Impact P/E Ratios
Probably the most important factor in determining what P/E a company trades on is the earnings growth. If earnings are growing quickly, then the 'E' in the equation will increase faster than it would otherwise. That means even if the current P/E is high, it will reduce over time if the share price stays flat. A lower P/E should indicate the stock is cheap relative to others -- and that may attract buyers.
FIT Hon Teng saw earnings per share improve by -4.7% last year. And its annual EPS growth rate over 3 years is 2.5%.
A Limitation: P/E Ratios Ignore Debt and Cash In The Bank
The 'Price' in P/E reflects the market capitalization of the company. That means it doesn't take debt or cash into account. Hypothetically, a company could reduce its future P/E ratio by spending its cash (or taking on debt) to achieve higher earnings.
While growth expenditure doesn't always pay off, the point is that it is a good option to have; but one that the P/E ratio ignores.
Is Debt Impacting FIT Hon Teng's P/E?
The extra options and safety that comes with FIT Hon Teng's US$182m net cash position means that it deserves a higher P/E than it would if it had a lot of net debt.
The Verdict On FIT Hon Teng's P/E Ratio
FIT Hon Teng has a P/E of 9.2. That's below the average in the HK market, which is 10.1. Recent earnings growth wasn't bad. And the net cash position gives the company many options. So it's strange that the low P/E indicates low expectations. Since analysts are predicting growth will continue, one might expect to see a higher P/E so it may be worth looking closer.
When the market is wrong about a stock, it gives savvy investors an opportunity. As value investor Benjamin Graham famously said, 'In the short run, the market is a voting machine but in the long run, it is a weighing machine. So this free visual report on analyst forecasts could hold the key to an excellent investment decision.
Of course you might be able to find a better stock than FIT Hon Teng. So you may wish to see this free collection of other companies that have grown earnings strongly.
If you spot an error that warrants correction, please contact the editor at editorial-team@simplywallst.com. This article by Simply Wall St is general in nature. It does not constitute a recommendation to buy or sell any stock, and does not take account of your objectives, or your financial situation. Simply Wall St has no position in the stocks mentioned.
We aim to bring you long-term focused research analysis driven by fundamental data. Note that our analysis may not factor in the latest price-sensitive company announcements or qualitative material. Thank you for reading.
