
How Do Public Joint-Stock Company Ukrtelecom’s (FRA:UK1) Returns On Capital Compare To Peers?

Today we are going to look at Public Joint-Stock Company Ukrtelecom (FRA:UK1) to see whether it might be an attractive investment prospect. In particular, we'll consider its Return On Capital Employed (ROCE), as that can give us insight into how profitably the company is able to employ capital in its business.
First up, we'll look at what ROCE is and how we calculate it. Then we'll compare its ROCE to similar companies. Then we'll determine how its current liabilities are affecting its ROCE.
What is Return On Capital Employed (ROCE)?
ROCE measures the 'return' (pre-tax profit) a company generates from capital employed in its business. Generally speaking a higher ROCE is better. In brief, it is a useful tool, but it is not without drawbacks. Renowned investment researcher Michael Mauboussin has suggested that a high ROCE can indicate that 'one dollar invested in the company generates value of more than one dollar'.
How Do You Calculate Return On Capital Employed?
The formula for calculating the return on capital employed is:
Return on Capital Employed = Earnings Before Interest and Tax (EBIT) ÷ (Total Assets - Current Liabilities)
Or for Ukrtelecom:
0.043 = ₴423m ÷ (₴12b - ₴2.0b) (Based on the trailing twelve months to December 2018.)
Therefore, Ukrtelecom has an ROCE of 4.3%.
Check out our latest analysis for Ukrtelecom
Is Ukrtelecom's ROCE Good?
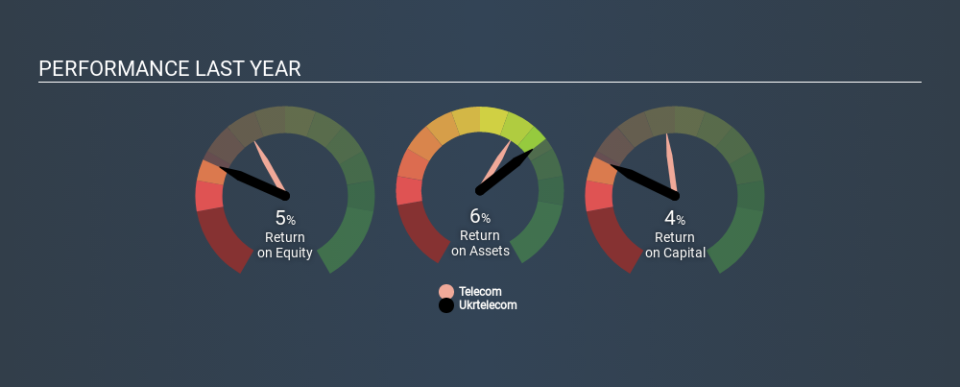
When making comparisons between similar businesses, investors may find ROCE useful. We can see Ukrtelecom's ROCE is meaningfully below the Telecom industry average of 8.9%. This could be seen as a negative, as it suggests some competitors may be employing their capital more efficiently. Separate from how Ukrtelecom stacks up against its industry, its ROCE in absolute terms is mediocre; relative to the returns on government bonds. Readers may find more attractive investment prospects elsewhere.
Ukrtelecom's current ROCE of 4.3% is lower than its ROCE in the past, which was 11%, 3 years ago. Therefore we wonder if the company is facing new headwinds. The image below shows how Ukrtelecom's ROCE compares to its industry, and you can click it to see more detail on its past growth.
It is important to remember that ROCE shows past performance, and is not necessarily predictive. ROCE can be misleading for companies in cyclical industries, with returns looking impressive during the boom times, but very weak during the busts. ROCE is only a point-in-time measure. How cyclical is Ukrtelecom? You can see for yourself by looking at this free graph of past earnings, revenue and cash flow.
How Ukrtelecom's Current Liabilities Impact Its ROCE
Current liabilities include invoices, such as supplier payments, short-term debt, or a tax bill, that need to be paid within 12 months. The ROCE equation subtracts current liabilities from capital employed, so a company with a lot of current liabilities appears to have less capital employed, and a higher ROCE than otherwise. To check the impact of this, we calculate if a company has high current liabilities relative to its total assets.
Ukrtelecom has total assets of ₴12b and current liabilities of ₴2.0b. Therefore its current liabilities are equivalent to approximately 17% of its total assets. This very reasonable level of current liabilities would not boost the ROCE by much.
The Bottom Line On Ukrtelecom's ROCE
If Ukrtelecom continues to earn an uninspiring ROCE, there may be better places to invest. Of course, you might find a fantastic investment by looking at a few good candidates. So take a peek at this free list of companies with modest (or no) debt, trading on a P/E below 20.
For those who like to find winning investments this free list of growing companies with recent insider purchasing, could be just the ticket.
If you spot an error that warrants correction, please contact the editor at editorial-team@simplywallst.com. This article by Simply Wall St is general in nature. It does not constitute a recommendation to buy or sell any stock, and does not take account of your objectives, or your financial situation. Simply Wall St has no position in the stocks mentioned.
We aim to bring you long-term focused research analysis driven by fundamental data. Note that our analysis may not factor in the latest price-sensitive company announcements or qualitative material. Thank you for reading.
