
Do You Like Performance Technologies S.A. (ATH:PERF) At This P/E Ratio?

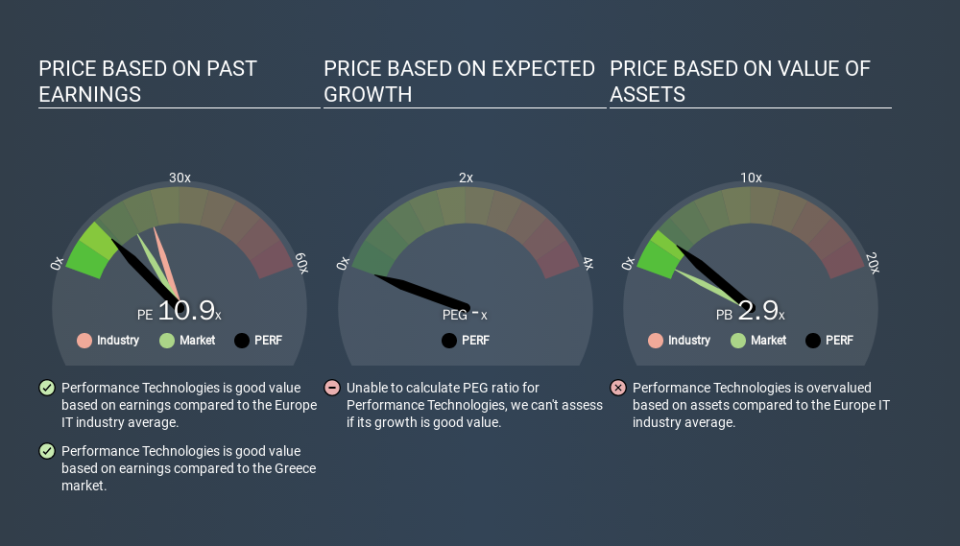
The goal of this article is to teach you how to use price to earnings ratios (P/E ratios). We'll apply a basic P/E ratio analysis to Performance Technologies S.A.'s (ATH:PERF), to help you decide if the stock is worth further research. What is Performance Technologies's P/E ratio? Well, based on the last twelve months it is 10.94. That corresponds to an earnings yield of approximately 9.1%.
See our latest analysis for Performance Technologies
How Do You Calculate A P/E Ratio?
The formula for P/E is:
Price to Earnings Ratio = Share Price ÷ Earnings per Share (EPS)
Or for Performance Technologies:
P/E of 10.94 = EUR3.30 ÷ EUR0.30 (Based on the trailing twelve months to June 2019.)
Is A High Price-to-Earnings Ratio Good?
A higher P/E ratio means that buyers have to pay a higher price for each EUR1 the company has earned over the last year. That isn't necessarily good or bad, but a high P/E implies relatively high expectations of what a company can achieve in the future.
How Does Performance Technologies's P/E Ratio Compare To Its Peers?
The P/E ratio indicates whether the market has higher or lower expectations of a company. If you look at the image below, you can see Performance Technologies has a lower P/E than the average (22.1) in the it industry classification.
This suggests that market participants think Performance Technologies will underperform other companies in its industry. While current expectations are low, the stock could be undervalued if the situation is better than the market assumes. If you consider the stock interesting, further research is recommended. For example, I often monitor director buying and selling.
How Growth Rates Impact P/E Ratios
Probably the most important factor in determining what P/E a company trades on is the earnings growth. Earnings growth means that in the future the 'E' will be higher. Therefore, even if you pay a high multiple of earnings now, that multiple will become lower in the future. So while a stock may look expensive based on past earnings, it could be cheap based on future earnings.
Performance Technologies increased earnings per share by an impressive 13% over the last twelve months. And it has improved its earnings per share by 50% per year over the last three years. So one might expect an above average P/E ratio.
A Limitation: P/E Ratios Ignore Debt and Cash In The Bank
Don't forget that the P/E ratio considers market capitalization. In other words, it does not consider any debt or cash that the company may have on the balance sheet. In theory, a company can lower its future P/E ratio by using cash or debt to invest in growth.
Such expenditure might be good or bad, in the long term, but the point here is that the balance sheet is not reflected by this ratio.
Performance Technologies's Balance Sheet
Performance Technologies has net debt worth 16% of its market capitalization. That's enough debt to impact the P/E ratio a little; so keep it in mind if you're comparing it to companies without debt.
The Verdict On Performance Technologies's P/E Ratio
Performance Technologies's P/E is 10.9 which is below average (16.9) in the GR market. The EPS growth last year was strong, and debt levels are quite reasonable. The low P/E ratio suggests current market expectations are muted, implying these levels of growth will not continue.
When the market is wrong about a stock, it gives savvy investors an opportunity. If it is underestimating a company, investors can make money by buying and holding the shares until the market corrects itself. We don't have analyst forecasts, but shareholders might want to examine this detailed historical graph of earnings, revenue and cash flow.
But note: Performance Technologies may not be the best stock to buy. So take a peek at this free list of interesting companies with strong recent earnings growth (and a P/E ratio below 20).
If you spot an error that warrants correction, please contact the editor at editorial-team@simplywallst.com. This article by Simply Wall St is general in nature. It does not constitute a recommendation to buy or sell any stock, and does not take account of your objectives, or your financial situation. Simply Wall St has no position in the stocks mentioned.
We aim to bring you long-term focused research analysis driven by fundamental data. Note that our analysis may not factor in the latest price-sensitive company announcements or qualitative material. Thank you for reading.
