
What Can We Learn From Tomra Systems ASA’s (OB:TOM) Investment Returns?

Today we are going to look at Tomra Systems ASA (OB:TOM) to see whether it might be an attractive investment prospect. In particular, we'll consider its Return On Capital Employed (ROCE), as that can give us insight into how profitably the company is able to employ capital in its business.
Firstly, we'll go over how we calculate ROCE. Second, we'll look at its ROCE compared to similar companies. Last but not least, we'll look at what impact its current liabilities have on its ROCE.
Return On Capital Employed (ROCE): What is it?
ROCE is a metric for evaluating how much pre-tax income (in percentage terms) a company earns on the capital invested in its business. In general, businesses with a higher ROCE are usually better quality. In brief, it is a useful tool, but it is not without drawbacks. Renowned investment researcher Michael Mauboussin has suggested that a high ROCE can indicate that 'one dollar invested in the company generates value of more than one dollar'.
How Do You Calculate Return On Capital Employed?
Analysts use this formula to calculate return on capital employed:
Return on Capital Employed = Earnings Before Interest and Tax (EBIT) ÷ (Total Assets - Current Liabilities)
Or for Tomra Systems:
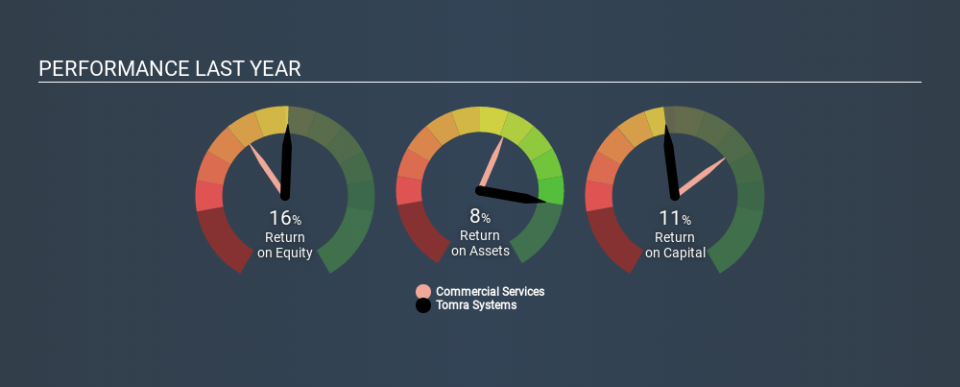
0.11 = kr1.2b ÷ (kr11b - kr292m) (Based on the trailing twelve months to December 2019.)
So, Tomra Systems has an ROCE of 11%.
Check out our latest analysis for Tomra Systems
Is Tomra Systems's ROCE Good?
ROCE is commonly used for comparing the performance of similar businesses. We can see Tomra Systems's ROCE is around the 10% average reported by the Commercial Services industry. Separate from Tomra Systems's performance relative to its industry, its ROCE in absolute terms looks satisfactory, and it may be worth researching in more depth.
We can see that, Tomra Systems currently has an ROCE of 11%, less than the 18% it reported 3 years ago. This makes us wonder if the business is facing new challenges. You can click on the image below to see (in greater detail) how Tomra Systems's past growth compares to other companies.
Remember that this metric is backwards looking - it shows what has happened in the past, and does not accurately predict the future. Companies in cyclical industries can be difficult to understand using ROCE, as returns typically look high during boom times, and low during busts. ROCE is only a point-in-time measure. What happens in the future is pretty important for investors, so we have prepared a free report on analyst forecasts for Tomra Systems.
Tomra Systems's Current Liabilities And Their Impact On Its ROCE
Liabilities, such as supplier bills and bank overdrafts, are referred to as current liabilities if they need to be paid within 12 months. The ROCE equation subtracts current liabilities from capital employed, so a company with a lot of current liabilities appears to have less capital employed, and a higher ROCE than otherwise. To counteract this, we check if a company has high current liabilities, relative to its total assets.
Tomra Systems has current liabilities of kr292m and total assets of kr11b. Therefore its current liabilities are equivalent to approximately 2.7% of its total assets. With low current liabilities, Tomra Systems's decent ROCE looks that much more respectable.
The Bottom Line On Tomra Systems's ROCE
If it is able to keep this up, Tomra Systems could be attractive. Tomra Systems looks strong on this analysis, but there are plenty of other companies that could be a good opportunity . Here is a free list of companies growing earnings rapidly.
If you like to buy stocks alongside management, then you might just love this free list of companies. (Hint: insiders have been buying them).
If you spot an error that warrants correction, please contact the editor at editorial-team@simplywallst.com. This article by Simply Wall St is general in nature. It does not constitute a recommendation to buy or sell any stock, and does not take account of your objectives, or your financial situation. Simply Wall St has no position in the stocks mentioned.
We aim to bring you long-term focused research analysis driven by fundamental data. Note that our analysis may not factor in the latest price-sensitive company announcements or qualitative material. Thank you for reading.

