
What Can We Learn From Fujikon Industrial Holdings Limited’s (HKG:927) Investment Returns?

Today we'll look at Fujikon Industrial Holdings Limited (HKG:927) and reflect on its potential as an investment. In particular, we'll consider its Return On Capital Employed (ROCE), as that can give us insight into how profitably the company is able to employ capital in its business.
First of all, we'll work out how to calculate ROCE. Then we'll compare its ROCE to similar companies. Then we'll determine how its current liabilities are affecting its ROCE.
Understanding Return On Capital Employed (ROCE)
ROCE measures the amount of pre-tax profits a company can generate from the capital employed in its business. All else being equal, a better business will have a higher ROCE. Ultimately, it is a useful but imperfect metric. Renowned investment researcher Michael Mauboussin has suggested that a high ROCE can indicate that 'one dollar invested in the company generates value of more than one dollar'.
So, How Do We Calculate ROCE?
Analysts use this formula to calculate return on capital employed:
Return on Capital Employed = Earnings Before Interest and Tax (EBIT) ÷ (Total Assets - Current Liabilities)
Or for Fujikon Industrial Holdings:
0.11 = HK$82m ÷ (HK$1.1b - HK$312m) (Based on the trailing twelve months to September 2019.)
Therefore, Fujikon Industrial Holdings has an ROCE of 11%.
Check out our latest analysis for Fujikon Industrial Holdings
Is Fujikon Industrial Holdings's ROCE Good?
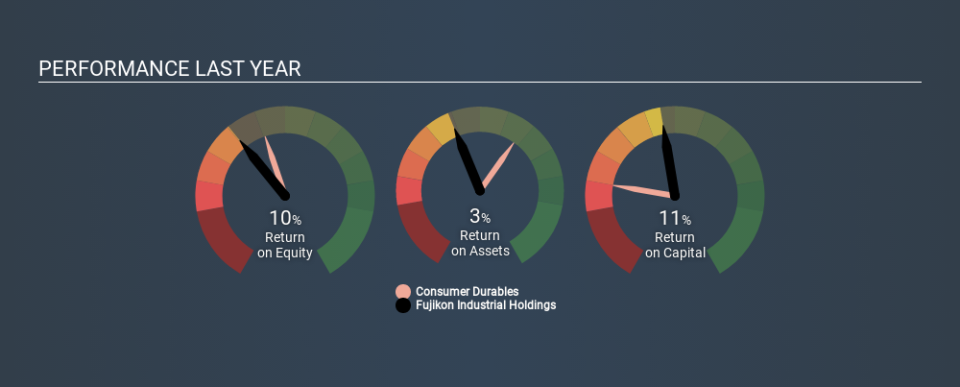
ROCE is commonly used for comparing the performance of similar businesses. It appears that Fujikon Industrial Holdings's ROCE is fairly close to the Consumer Durables industry average of 10%. Separate from Fujikon Industrial Holdings's performance relative to its industry, its ROCE in absolute terms looks satisfactory, and it may be worth researching in more depth.
Our data shows that Fujikon Industrial Holdings currently has an ROCE of 11%, compared to its ROCE of 2.4% 3 years ago. This makes us wonder if the company is improving. You can see in the image below how Fujikon Industrial Holdings's ROCE compares to its industry. Click to see more on past growth.
When considering this metric, keep in mind that it is backwards looking, and not necessarily predictive. ROCE can be misleading for companies in cyclical industries, with returns looking impressive during the boom times, but very weak during the busts. ROCE is, after all, simply a snap shot of a single year. You can check if Fujikon Industrial Holdings has cyclical profits by looking at this free graph of past earnings, revenue and cash flow.
What Are Current Liabilities, And How Do They Affect Fujikon Industrial Holdings's ROCE?
Current liabilities are short term bills and invoices that need to be paid in 12 months or less. The ROCE equation subtracts current liabilities from capital employed, so a company with a lot of current liabilities appears to have less capital employed, and a higher ROCE than otherwise. To counter this, investors can check if a company has high current liabilities relative to total assets.
Fujikon Industrial Holdings has total assets of HK$1.1b and current liabilities of HK$312m. As a result, its current liabilities are equal to approximately 29% of its total assets. A fairly low level of current liabilities is not influencing the ROCE too much.
What We Can Learn From Fujikon Industrial Holdings's ROCE
Overall, Fujikon Industrial Holdings has a decent ROCE and could be worthy of further research. Fujikon Industrial Holdings shapes up well under this analysis, but it is far from the only business delivering excellent numbers . You might also want to check this free collection of companies delivering excellent earnings growth.
If you like to buy stocks alongside management, then you might just love this free list of companies. (Hint: insiders have been buying them).
If you spot an error that warrants correction, please contact the editor at editorial-team@simplywallst.com. This article by Simply Wall St is general in nature. It does not constitute a recommendation to buy or sell any stock, and does not take account of your objectives, or your financial situation. Simply Wall St has no position in the stocks mentioned.
We aim to bring you long-term focused research analysis driven by fundamental data. Note that our analysis may not factor in the latest price-sensitive company announcements or qualitative material. Thank you for reading.
