
Are Las Vegas Sands Corp.’s (NYSE:LVS) High Returns Really That Great?

Today we'll look at Las Vegas Sands Corp. (NYSE:LVS) and reflect on its potential as an investment. Specifically, we're going to calculate its Return On Capital Employed (ROCE), in the hopes of getting some insight into the business.
First, we'll go over how we calculate ROCE. Second, we'll look at its ROCE compared to similar companies. Finally, we'll look at how its current liabilities affect its ROCE.
Understanding Return On Capital Employed (ROCE)
ROCE is a metric for evaluating how much pre-tax income (in percentage terms) a company earns on the capital invested in its business. Generally speaking a higher ROCE is better. Ultimately, it is a useful but imperfect metric. Renowned investment researcher Michael Mauboussin has suggested that a high ROCE can indicate that 'one dollar invested in the company generates value of more than one dollar'.
So, How Do We Calculate ROCE?
Analysts use this formula to calculate return on capital employed:
Return on Capital Employed = Earnings Before Interest and Tax (EBIT) ÷ (Total Assets - Current Liabilities)
Or for Las Vegas Sands:
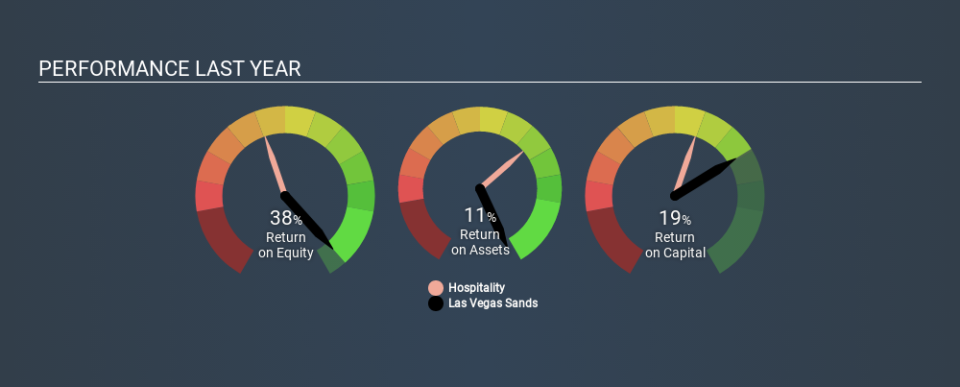
0.19 = US$3.7b ÷ (US$22b - US$3.0b) (Based on the trailing twelve months to September 2019.)
So, Las Vegas Sands has an ROCE of 19%.
Check out our latest analysis for Las Vegas Sands
Is Las Vegas Sands's ROCE Good?
ROCE can be useful when making comparisons, such as between similar companies. Las Vegas Sands's ROCE appears to be substantially greater than the 8.5% average in the Hospitality industry. I think that's good to see, since it implies the company is better than other companies at making the most of its capital. Regardless of where Las Vegas Sands sits next to its industry, its ROCE in absolute terms appears satisfactory, and this company could be worth a closer look.
We can see that, Las Vegas Sands currently has an ROCE of 19% compared to its ROCE 3 years ago, which was 14%. This makes us think the business might be improving. You can click on the image below to see (in greater detail) how Las Vegas Sands's past growth compares to other companies.
Remember that this metric is backwards looking - it shows what has happened in the past, and does not accurately predict the future. Companies in cyclical industries can be difficult to understand using ROCE, as returns typically look high during boom times, and low during busts. ROCE is only a point-in-time measure. Since the future is so important for investors, you should check out our free report on analyst forecasts for Las Vegas Sands.
Do Las Vegas Sands's Current Liabilities Skew Its ROCE?
Current liabilities include invoices, such as supplier payments, short-term debt, or a tax bill, that need to be paid within 12 months. Due to the way ROCE is calculated, a high level of current liabilities makes a company look as though it has less capital employed, and thus can (sometimes unfairly) boost the ROCE. To counteract this, we check if a company has high current liabilities, relative to its total assets.
Las Vegas Sands has total assets of US$22b and current liabilities of US$3.0b. As a result, its current liabilities are equal to approximately 13% of its total assets. A fairly low level of current liabilities is not influencing the ROCE too much.
What We Can Learn From Las Vegas Sands's ROCE
This is good to see, and with a sound ROCE, Las Vegas Sands could be worth a closer look. Las Vegas Sands shapes up well under this analysis, but it is far from the only business delivering excellent numbers . You might also want to check this free collection of companies delivering excellent earnings growth.
For those who like to find winning investments this free list of growing companies with recent insider purchasing, could be just the ticket.
If you spot an error that warrants correction, please contact the editor at editorial-team@simplywallst.com. This article by Simply Wall St is general in nature. It does not constitute a recommendation to buy or sell any stock, and does not take account of your objectives, or your financial situation. Simply Wall St has no position in the stocks mentioned.
We aim to bring you long-term focused research analysis driven by fundamental data. Note that our analysis may not factor in the latest price-sensitive company announcements or qualitative material. Thank you for reading.
