
What Kind Of Shareholders Hold The Majority In Webster Financial Corporation's (NYSE:WBS) Shares?

Every investor in Webster Financial Corporation (NYSE:WBS) should be aware of the most powerful shareholder groups. Insiders often own a large chunk of younger, smaller, companies while huge companies tend to have institutions as shareholders. We also tend to see lower insider ownership in companies that were previously publicly owned.
Webster Financial has a market capitalization of US$2.5b, so we would expect some institutional investors to have noticed the stock. In the chart below, we can see that institutions own shares in the company. Let's delve deeper into each type of owner, to discover more about Webster Financial.
See our latest analysis for Webster Financial

What Does The Institutional Ownership Tell Us About Webster Financial?
Institutions typically measure themselves against a benchmark when reporting to their own investors, so they often become more enthusiastic about a stock once it's included in a major index. We would expect most companies to have some institutions on the register, especially if they are growing.
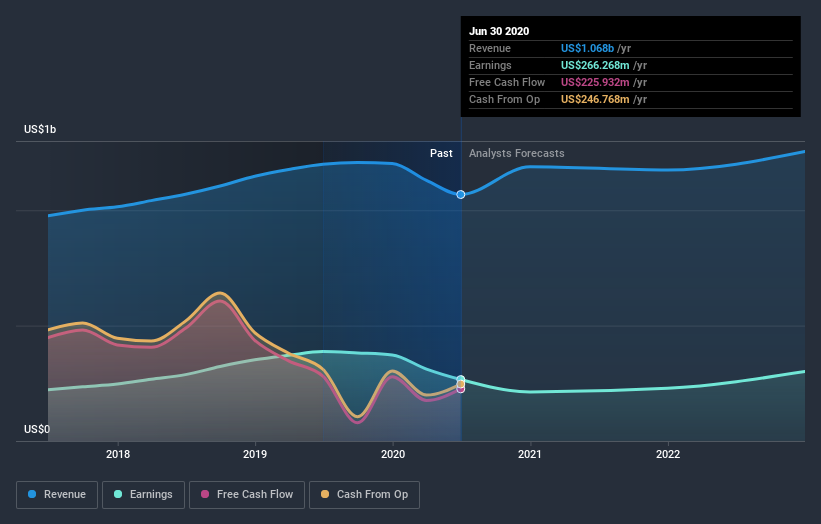
We can see that Webster Financial does have institutional investors; and they hold a good portion of the company's stock. This implies the analysts working for those institutions have looked at the stock and they like it. But just like anyone else, they could be wrong. When multiple institutions own a stock, there's always a risk that they are in a 'crowded trade'. When such a trade goes wrong, multiple parties may compete to sell stock fast. This risk is higher in a company without a history of growth. You can see Webster Financial's historic earnings and revenue below, but keep in mind there's always more to the story.
Since institutional investors own more than half the issued stock, the board will likely have to pay attention to their preferences. Hedge funds don't have many shares in Webster Financial. T. Rowe Price Group, Inc. is currently the company's largest shareholder with 14% of shares outstanding. In comparison, the second and third largest shareholders hold about 9.8% and 9.1% of the stock.
We did some more digging and found that 9 of the top shareholders account for roughly 52% of the register, implying that along with larger shareholders, there are a few smaller shareholders, thereby balancing out each others interests somewhat.
While it makes sense to study institutional ownership data for a company, it also makes sense to study analyst sentiments to know which way the wind is blowing. There are plenty of analysts covering the stock, so it might be worth seeing what they are forecasting, too.
Insider Ownership Of Webster Financial
The definition of an insider can differ slightly between different countries, but members of the board of directors always count. Management ultimately answers to the board. However, it is not uncommon for managers to be executive board members, especially if they are a founder or the CEO.
Insider ownership is positive when it signals leadership are thinking like the true owners of the company. However, high insider ownership can also give immense power to a small group within the company. This can be negative in some circumstances.
I can report that insiders do own shares in Webster Financial Corporation. The insiders have a meaningful stake worth US$31m. Most would see this as a real positive. Most would say this shows alignment of interests between shareholders and the board. Still, it might be worth checking if those insiders have been selling.
General Public Ownership
With a 10% ownership, the general public have some degree of sway over Webster Financial. While this size of ownership may not be enough to sway a policy decision in their favour, they can still make a collective impact on company policies.
Next Steps:
While it is well worth considering the different groups that own a company, there are other factors that are even more important.
I always like to check for a history of revenue growth. You can too, by accessing this free chart of historic revenue and earnings in this detailed graph.
If you would prefer discover what analysts are predicting in terms of future growth, do not miss this free report on analyst forecasts.
NB: Figures in this article are calculated using data from the last twelve months, which refer to the 12-month period ending on the last date of the month the financial statement is dated. This may not be consistent with full year annual report figures.
This article by Simply Wall St is general in nature. It does not constitute a recommendation to buy or sell any stock, and does not take account of your objectives, or your financial situation. We aim to bring you long-term focused analysis driven by fundamental data. Note that our analysis may not factor in the latest price-sensitive company announcements or qualitative material. Simply Wall St has no position in any stocks mentioned.
Have feedback on this article? Concerned about the content? Get in touch with us directly. Alternatively, email editorial-team@simplywallst.com.

