
Introducing Chart Industries (NASDAQ:GTLS), The Stock That Zoomed 234% In The Last Five Years

The worst result, after buying shares in a company (assuming no leverage), would be if you lose all the money you put in. But on the bright side, if you buy shares in a high quality company at the right price, you can gain well over 100%. For instance, the price of Chart Industries, Inc. (NASDAQ:GTLS) stock is up an impressive 234% over the last five years. On top of that, the share price is up 44% in about a quarter.
Check out our latest analysis for Chart Industries
To quote Buffett, 'Ships will sail around the world but the Flat Earth Society will flourish. There will continue to be wide discrepancies between price and value in the marketplace...' One imperfect but simple way to consider how the market perception of a company has shifted is to compare the change in the earnings per share (EPS) with the share price movement.
During five years of share price growth, Chart Industries actually saw its EPS drop 6.7% per year.
Essentially, it doesn't seem likely that investors are focused on EPS. Since the change in EPS doesn't seem to correlate with the change in share price, it's worth taking a look at other metrics.
On the other hand, Chart Industries' revenue is growing nicely, at a compound rate of 6.4% over the last five years. It's quite possible that management are prioritizing revenue growth over EPS growth at the moment.
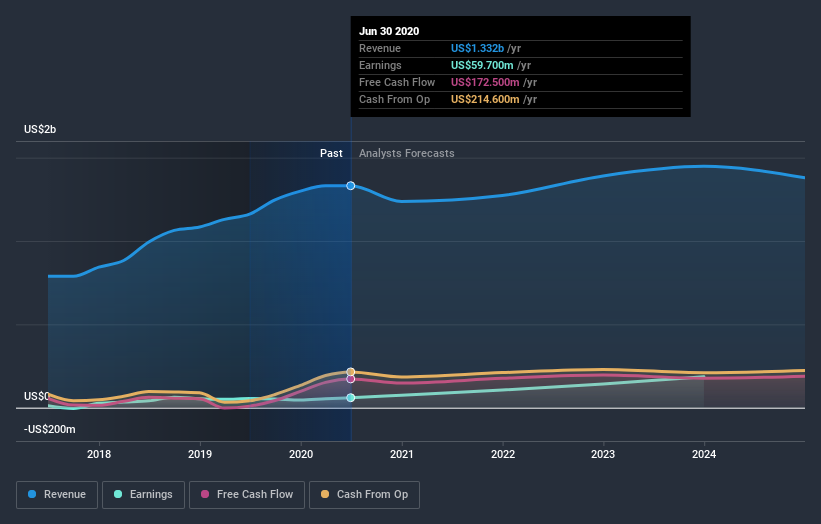
You can see below how earnings and revenue have changed over time (discover the exact values by clicking on the image).
We consider it positive that insiders have made significant purchases in the last year. Having said that, most people consider earnings and revenue growth trends to be a more meaningful guide to the business. This free report showing analyst forecasts should help you form a view on Chart Industries
A Different Perspective
Chart Industries shareholders gained a total return of 1.5% during the year. Unfortunately this falls short of the market return. On the bright side, the longer term returns (running at about 27% a year, over half a decade) look better. Maybe the share price is just taking a breather while the business executes on its growth strategy. It's always interesting to track share price performance over the longer term. But to understand Chart Industries better, we need to consider many other factors. For instance, we've identified 3 warning signs for Chart Industries that you should be aware of.
There are plenty of other companies that have insiders buying up shares. You probably do not want to miss this free list of growing companies that insiders are buying.
Please note, the market returns quoted in this article reflect the market weighted average returns of stocks that currently trade on US exchanges.
This article by Simply Wall St is general in nature. It does not constitute a recommendation to buy or sell any stock, and does not take account of your objectives, or your financial situation. We aim to bring you long-term focused analysis driven by fundamental data. Note that our analysis may not factor in the latest price-sensitive company announcements or qualitative material. Simply Wall St has no position in any stocks mentioned.
Have feedback on this article? Concerned about the content? Get in touch with us directly. Alternatively, email editorial-team@simplywallst.com.

