
What Is Eternity Technology Holdings's (HKG:1725) P/E Ratio After Its Share Price Tanked?

Unfortunately for some shareholders, the Eternity Technology Holdings (HKG:1725) share price has dived 35% in the last thirty days. Even longer term holders have taken a real hit with the stock declining 14% in the last year.
All else being equal, a share price drop should make a stock more attractive to potential investors. While the market sentiment towards a stock is very changeable, in the long run, the share price will tend to move in the same direction as earnings per share. The implication here is that long term investors have an opportunity when expectations of a company are too low. One way to gauge market expectations of a stock is to look at its Price to Earnings Ratio (PE Ratio). A high P/E implies that investors have high expectations of what a company can achieve compared to a company with a low P/E ratio.
See our latest analysis for Eternity Technology Holdings
How Does Eternity Technology Holdings's P/E Ratio Compare To Its Peers?
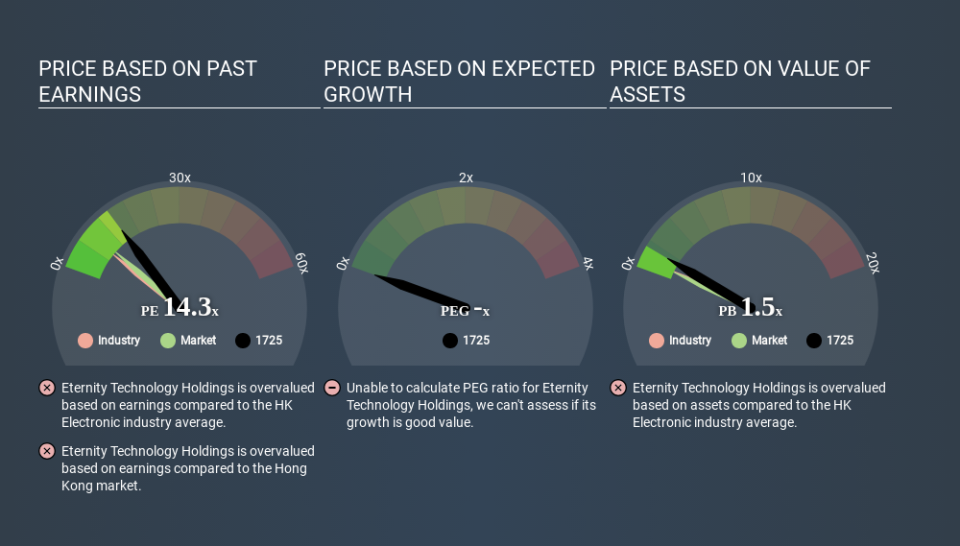
We can tell from its P/E ratio of 14.33 that there is some investor optimism about Eternity Technology Holdings. You can see in the image below that the average P/E (8.1) for companies in the electronic industry is lower than Eternity Technology Holdings's P/E.
Eternity Technology Holdings's P/E tells us that market participants think the company will perform better than its industry peers, going forward. Shareholders are clearly optimistic, but the future is always uncertain. So investors should delve deeper. I like to check if company insiders have been buying or selling.
How Growth Rates Impact P/E Ratios
Earnings growth rates have a big influence on P/E ratios. Earnings growth means that in the future the 'E' will be higher. Therefore, even if you pay a high multiple of earnings now, that multiple will become lower in the future. A lower P/E should indicate the stock is cheap relative to others -- and that may attract buyers.
Eternity Technology Holdings saw earnings per share improve by 4.4% last year.
Don't Forget: The P/E Does Not Account For Debt or Bank Deposits
It's important to note that the P/E ratio considers the market capitalization, not the enterprise value. Thus, the metric does not reflect cash or debt held by the company. Hypothetically, a company could reduce its future P/E ratio by spending its cash (or taking on debt) to achieve higher earnings.
While growth expenditure doesn't always pay off, the point is that it is a good option to have; but one that the P/E ratio ignores.
So What Does Eternity Technology Holdings's Balance Sheet Tell Us?
With net cash of CN¥107m, Eternity Technology Holdings has a very strong balance sheet, which may be important for its business. Having said that, at 29% of its market capitalization the cash hoard would contribute towards a higher P/E ratio.
The Verdict On Eternity Technology Holdings's P/E Ratio
Eternity Technology Holdings's P/E is 14.3 which is above average (9.1) in its market. Earnings improved over the last year. Also positive, the relatively strong balance sheet will allow for investment in growth -- and the P/E indicates shareholders that will happen! What can be absolutely certain is that the market has become significantly less optimistic about Eternity Technology Holdings over the last month, with the P/E ratio falling from 22.1 back then to 14.3 today. For those who don't like to trade against momentum, that could be a warning sign, but a contrarian investor might want to take a closer look.
Investors have an opportunity when market expectations about a stock are wrong. People often underestimate remarkable growth -- so investors can make money when fast growth is not fully appreciated. Although we don't have analyst forecasts shareholders might want to examine this detailed historical graph of earnings, revenue and cash flow.
But note: Eternity Technology Holdings may not be the best stock to buy. So take a peek at this free list of interesting companies with strong recent earnings growth (and a P/E ratio below 20).
If you spot an error that warrants correction, please contact the editor at editorial-team@simplywallst.com. This article by Simply Wall St is general in nature. It does not constitute a recommendation to buy or sell any stock, and does not take account of your objectives, or your financial situation. Simply Wall St has no position in the stocks mentioned.
We aim to bring you long-term focused research analysis driven by fundamental data. Note that our analysis may not factor in the latest price-sensitive company announcements or qualitative material. Thank you for reading.
