
Estimating The Intrinsic Value Of Betterware de Mexico, S.A.B. de C.V. (NASDAQ:BWMX)

Today we'll do a simple run through of a valuation method used to estimate the attractiveness of Betterware de Mexico, S.A.B. de C.V. (NASDAQ:BWMX) as an investment opportunity by taking the expected future cash flows and discounting them to today's value. The Discounted Cash Flow (DCF) model is the tool we will apply to do this. Before you think you won't be able to understand it, just read on! It's actually much less complex than you'd imagine.
We would caution that there are many ways of valuing a company and, like the DCF, each technique has advantages and disadvantages in certain scenarios. For those who are keen learners of equity analysis, the Simply Wall St analysis model here may be something of interest to you.
Check out our latest analysis for Betterware de Mexico. de
The model
We use what is known as a 2-stage model, which simply means we have two different periods of growth rates for the company's cash flows. Generally the first stage is higher growth, and the second stage is a lower growth phase. In the first stage we need to estimate the cash flows to the business over the next ten years. Where possible we use analyst estimates, but when these aren't available we extrapolate the previous free cash flow (FCF) from the last estimate or reported value. We assume companies with shrinking free cash flow will slow their rate of shrinkage, and that companies with growing free cash flow will see their growth rate slow, over this period. We do this to reflect that growth tends to slow more in the early years than it does in later years.
A DCF is all about the idea that a dollar in the future is less valuable than a dollar today, so we need to discount the sum of these future cash flows to arrive at a present value estimate:
10-year free cash flow (FCF) forecast
2021 | 2022 | 2023 | 2024 | 2025 | 2026 | 2027 | 2028 | 2029 | 2030 | |
Levered FCF (MX$, Millions) | Mex$780.0m | Mex$1.36b | Mex$1.59b | Mex$1.76b | Mex$1.90b | Mex$2.03b | Mex$2.13b | Mex$2.22b | Mex$2.30b | Mex$2.38b |
Growth Rate Estimate Source | Analyst x1 | Analyst x1 | Analyst x1 | Est @ 10.77% | Est @ 8.2% | Est @ 6.41% | Est @ 5.15% | Est @ 4.27% | Est @ 3.66% | Est @ 3.23% |
Present Value (MX$, Millions) Discounted @ 12% | Mex$694 | Mex$1.1k | Mex$1.1k | Mex$1.1k | Mex$1.1k | Mex$1.0k | Mex$943 | Mex$875 | Mex$807 | Mex$742 |
("Est" = FCF growth rate estimated by Simply Wall St)
Present Value of 10-year Cash Flow (PVCF) = Mex$9.4b
After calculating the present value of future cash flows in the initial 10-year period, we need to calculate the Terminal Value, which accounts for all future cash flows beyond the first stage. The Gordon Growth formula is used to calculate Terminal Value at a future annual growth rate equal to the 5-year average of the 10-year government bond yield of 2.2%. We discount the terminal cash flows to today's value at a cost of equity of 12%.
Terminal Value (TV)= FCF2030 × (1 + g) ÷ (r – g) = Mex$2.4b× (1 + 2.2%) ÷ (12%– 2.2%) = Mex$24b
Present Value of Terminal Value (PVTV)= TV / (1 + r)10= Mex$24b÷ ( 1 + 12%)10= Mex$7.5b
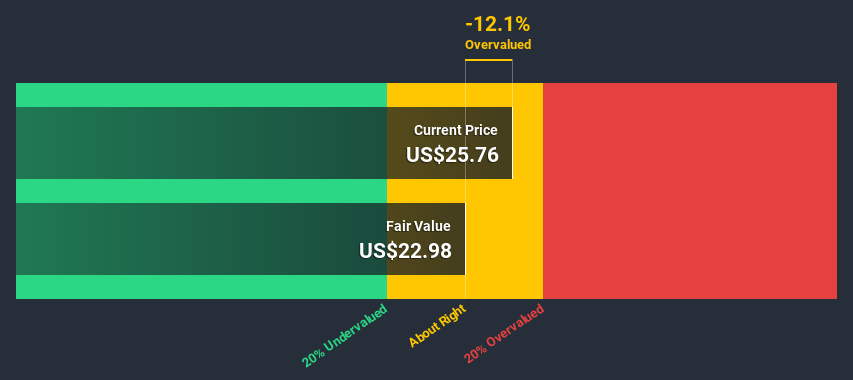
The total value is the sum of cash flows for the next ten years plus the discounted terminal value, which results in the Total Equity Value, which in this case is Mex$17b. In the final step we divide the equity value by the number of shares outstanding. Relative to the current share price of US$25.8, the company appears around fair value at the time of writing. Valuations are imprecise instruments though, rather like a telescope - move a few degrees and end up in a different galaxy. Do keep this in mind.
The assumptions
We would point out that the most important inputs to a discounted cash flow are the discount rate and of course the actual cash flows. Part of investing is coming up with your own evaluation of a company's future performance, so try the calculation yourself and check your own assumptions. The DCF also does not consider the possible cyclicality of an industry, or a company's future capital requirements, so it does not give a full picture of a company's potential performance. Given that we are looking at Betterware de Mexico. de as potential shareholders, the cost of equity is used as the discount rate, rather than the cost of capital (or weighted average cost of capital, WACC) which accounts for debt. In this calculation we've used 12%, which is based on a levered beta of 1.234. Beta is a measure of a stock's volatility, compared to the market as a whole. We get our beta from the industry average beta of globally comparable companies, with an imposed limit between 0.8 and 2.0, which is a reasonable range for a stable business.
Moving On:
Whilst important, the DCF calculation shouldn't be the only metric you look at when researching a company. DCF models are not the be-all and end-all of investment valuation. Preferably you'd apply different cases and assumptions and see how they would impact the company's valuation. If a company grows at a different rate, or if its cost of equity or risk free rate changes sharply, the output can look very different. For Betterware de Mexico. de, we've compiled three further elements you should further examine:
Risks: Be aware that Betterware de Mexico. de is showing 3 warning signs in our investment analysis , you should know about...
Future Earnings: How does BWMX's growth rate compare to its peers and the wider market? Dig deeper into the analyst consensus number for the upcoming years by interacting with our free analyst growth expectation chart.
Other High Quality Alternatives: Do you like a good all-rounder? Explore our interactive list of high quality stocks to get an idea of what else is out there you may be missing!
PS. Simply Wall St updates its DCF calculation for every American stock every day, so if you want to find the intrinsic value of any other stock just search here.
This article by Simply Wall St is general in nature. It does not constitute a recommendation to buy or sell any stock, and does not take account of your objectives, or your financial situation. We aim to bring you long-term focused analysis driven by fundamental data. Note that our analysis may not factor in the latest price-sensitive company announcements or qualitative material. Simply Wall St has no position in any stocks mentioned.
Have feedback on this article? Concerned about the content? Get in touch with us directly. Alternatively, email editorial-team@simplywallst.com.

