
How Do ElringKlinger AG’s (ETR:ZIL2) Returns On Capital Compare To Peers?

Today we'll evaluate ElringKlinger AG (ETR:ZIL2) to determine whether it could have potential as an investment idea. To be precise, we'll consider its Return On Capital Employed (ROCE), as that will inform our view of the quality of the business.
First of all, we'll work out how to calculate ROCE. Second, we'll look at its ROCE compared to similar companies. Last but not least, we'll look at what impact its current liabilities have on its ROCE.
Understanding Return On Capital Employed (ROCE)
ROCE measures the 'return' (pre-tax profit) a company generates from capital employed in its business. All else being equal, a better business will have a higher ROCE. Overall, it is a valuable metric that has its flaws. Author Edwin Whiting says to be careful when comparing the ROCE of different businesses, since 'No two businesses are exactly alike.
So, How Do We Calculate ROCE?
The formula for calculating the return on capital employed is:
Return on Capital Employed = Earnings Before Interest and Tax (EBIT) ÷ (Total Assets - Current Liabilities)
Or for ElringKlinger:
0.027 = €45m ÷ (€2.1b - €482m) (Based on the trailing twelve months to December 2019.)
So, ElringKlinger has an ROCE of 2.7%.
See our latest analysis for ElringKlinger
Is ElringKlinger's ROCE Good?
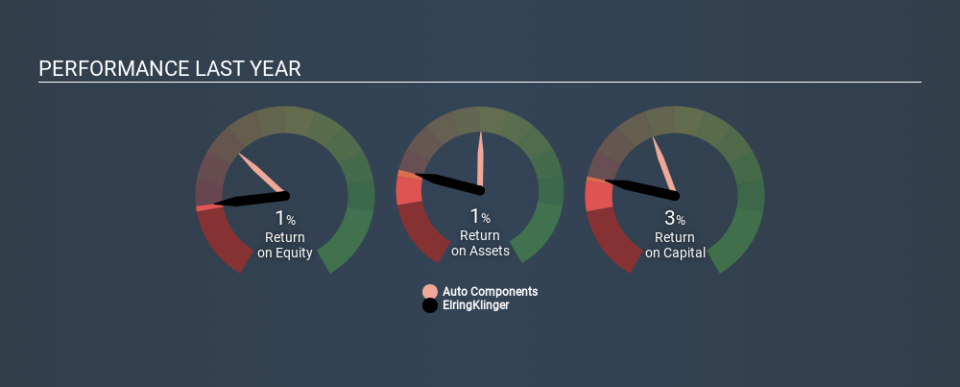
When making comparisons between similar businesses, investors may find ROCE useful. In this analysis, ElringKlinger's ROCE appears meaningfully below the 8.4% average reported by the Auto Components industry. This could be seen as a negative, as it suggests some competitors may be employing their capital more efficiently. Setting aside the industry comparison for now, ElringKlinger's ROCE is mediocre in absolute terms, considering the risk of investing in stocks versus the safety of a bank account. Investors may wish to consider higher-performing investments.
ElringKlinger's current ROCE of 2.7% is lower than 3 years ago, when the company reported a 9.5% ROCE. So investors might consider if it has had issues recently. The image below shows how ElringKlinger's ROCE compares to its industry, and you can click it to see more detail on its past growth.
It is important to remember that ROCE shows past performance, and is not necessarily predictive. Companies in cyclical industries can be difficult to understand using ROCE, as returns typically look high during boom times, and low during busts. This is because ROCE only looks at one year, instead of considering returns across a whole cycle. Since the future is so important for investors, you should check out our free report on analyst forecasts for ElringKlinger.
How ElringKlinger's Current Liabilities Impact Its ROCE
Short term (or current) liabilities, are things like supplier invoices, overdrafts, or tax bills that need to be paid within 12 months. The ROCE equation subtracts current liabilities from capital employed, so a company with a lot of current liabilities appears to have less capital employed, and a higher ROCE than otherwise. To counter this, investors can check if a company has high current liabilities relative to total assets.
ElringKlinger has current liabilities of €482m and total assets of €2.1b. Therefore its current liabilities are equivalent to approximately 22% of its total assets. This very reasonable level of current liabilities would not boost the ROCE by much.
The Bottom Line On ElringKlinger's ROCE
With that in mind, we're not overly impressed with ElringKlinger's ROCE, so it may not be the most appealing prospect. But note: make sure you look for a great company, not just the first idea you come across. So take a peek at this free list of interesting companies with strong recent earnings growth (and a P/E ratio below 20).
For those who like to find winning investments this free list of growing companies with recent insider purchasing, could be just the ticket.
If you spot an error that warrants correction, please contact the editor at editorial-team@simplywallst.com. This article by Simply Wall St is general in nature. It does not constitute a recommendation to buy or sell any stock, and does not take account of your objectives, or your financial situation. Simply Wall St has no position in the stocks mentioned.
We aim to bring you long-term focused research analysis driven by fundamental data. Note that our analysis may not factor in the latest price-sensitive company announcements or qualitative material. Thank you for reading.
