
Does Waterco Limited's (ASX:WAT) Past Performance Indicate A Stronger Future?

Examining Waterco Limited's (ASX:WAT) past track record of performance is a valuable exercise for investors. It enables us to understand whether the company has met or exceed expectations, which is a powerful signal for future performance. Below, I will assess WAT's latest performance announced on 31 December 2019 and weigh these figures against its longer term trend and industry movements.
View our latest analysis for Waterco
Could WAT beat the long-term trend and outperform its industry?
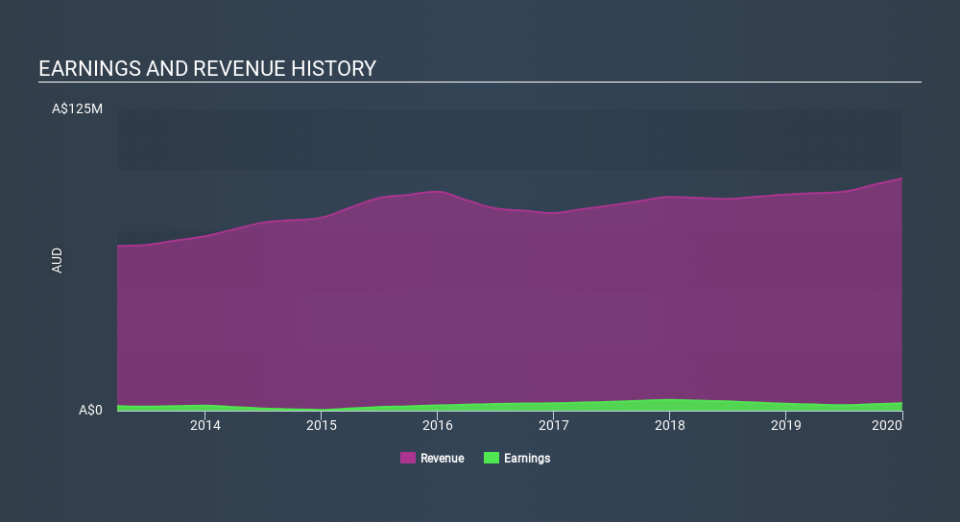
WAT's trailing twelve-month earnings (from 31 December 2019) of AU$3.1m has increased by 7.3% compared to the previous year.
However, this one-year growth rate has been lower than its average earnings growth rate over the past 5 years of 14%, indicating the rate at which WAT is growing has slowed down. What could be happening here? Well, let's examine what's transpiring with margins and whether the whole industry is experiencing the hit as well.
In terms of returns from investment, Waterco has fallen short of achieving a 20% return on equity (ROE), recording 3.9% instead. Furthermore, its return on assets (ROA) of 3.0% is below the AU Leisure industry of 6.0%, indicating Waterco's are utilized less efficiently. And finally, its return on capital (ROC), which also accounts for Waterco’s debt level, has declined over the past 3 years from 6.9% to 4.9%.
What does this mean?
Waterco's track record can be a valuable insight into its earnings performance, but it certainly doesn't tell the whole story. While Waterco has a good historical track record with positive growth and profitability, there's no certainty that this will extrapolate into the future. You should continue to research Waterco to get a more holistic view of the stock by looking at:
Financial Health: Are WAT’s operations financially sustainable? Balance sheets can be hard to analyze, which is why we’ve done it for you. Check out our financial health checks here.
Valuation: What is WAT worth today? Is the stock undervalued, even when its growth outlook is factored into its intrinsic value? The intrinsic value infographic in our free research report helps visualize whether WAT is currently mispriced by the market.
Other High-Performing Stocks: Are there other stocks that provide better prospects with proven track records? Explore our free list of these great stocks here.
NB: Figures in this article are calculated using data from the trailing twelve months from 31 December 2019. This may not be consistent with full year annual report figures.
If you spot an error that warrants correction, please contact the editor at editorial-team@simplywallst.com. This article by Simply Wall St is general in nature. It does not constitute a recommendation to buy or sell any stock, and does not take account of your objectives, or your financial situation. Simply Wall St has no position in the stocks mentioned.
We aim to bring you long-term focused research analysis driven by fundamental data. Note that our analysis may not factor in the latest price-sensitive company announcements or qualitative material. Thank you for reading.

