
What Does Unibel S.A.’s (EPA:UNBL) 6.6% ROCE Say About The Business?

Today we'll evaluate Unibel S.A. (EPA:UNBL) to determine whether it could have potential as an investment idea. To be precise, we'll consider its Return On Capital Employed (ROCE), as that will inform our view of the quality of the business.
First of all, we'll work out how to calculate ROCE. Then we'll compare its ROCE to similar companies. Last but not least, we'll look at what impact its current liabilities have on its ROCE.
Understanding Return On Capital Employed (ROCE)
ROCE measures the 'return' (pre-tax profit) a company generates from capital employed in its business. In general, businesses with a higher ROCE are usually better quality. In brief, it is a useful tool, but it is not without drawbacks. Author Edwin Whiting says to be careful when comparing the ROCE of different businesses, since 'No two businesses are exactly alike.
How Do You Calculate Return On Capital Employed?
Analysts use this formula to calculate return on capital employed:
Return on Capital Employed = Earnings Before Interest and Tax (EBIT) ÷ (Total Assets - Current Liabilities)
Or for Unibel:
0.066 = €209m ÷ (€4.0b - €834m) (Based on the trailing twelve months to December 2019.)
So, Unibel has an ROCE of 6.6%.
View our latest analysis for Unibel
Is Unibel's ROCE Good?
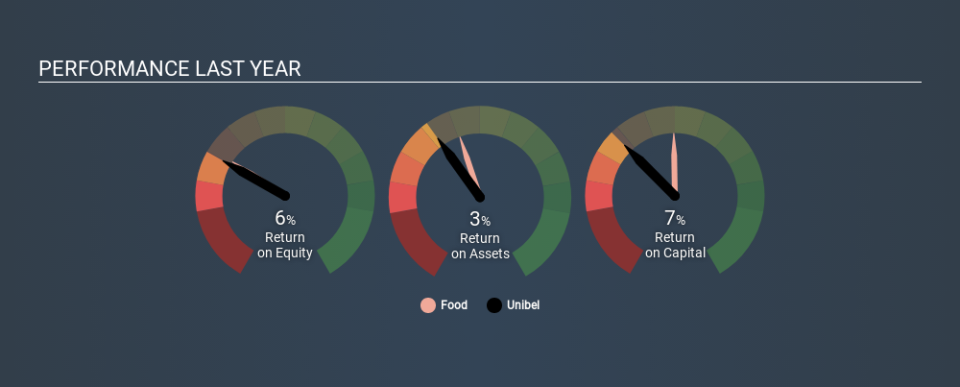
ROCE is commonly used for comparing the performance of similar businesses. We can see Unibel's ROCE is around the 6.8% average reported by the Food industry. Separate from how Unibel stacks up against its industry, its ROCE in absolute terms is mediocre; relative to the returns on government bonds. Investors may wish to consider higher-performing investments.
Unibel's current ROCE of 6.6% is lower than 3 years ago, when the company reported a 12% ROCE. So investors might consider if it has had issues recently. You can click on the image below to see (in greater detail) how Unibel's past growth compares to other companies.
When considering this metric, keep in mind that it is backwards looking, and not necessarily predictive. Companies in cyclical industries can be difficult to understand using ROCE, as returns typically look high during boom times, and low during busts. ROCE is, after all, simply a snap shot of a single year. How cyclical is Unibel? You can see for yourself by looking at this free graph of past earnings, revenue and cash flow.
How Unibel's Current Liabilities Impact Its ROCE
Short term (or current) liabilities, are things like supplier invoices, overdrafts, or tax bills that need to be paid within 12 months. Due to the way the ROCE equation works, having large bills due in the near term can make it look as though a company has less capital employed, and thus a higher ROCE than usual. To check the impact of this, we calculate if a company has high current liabilities relative to its total assets.
Unibel has total assets of €4.0b and current liabilities of €834m. As a result, its current liabilities are equal to approximately 21% of its total assets. This is a modest level of current liabilities, which would only have a small effect on ROCE.
What We Can Learn From Unibel's ROCE
That said, Unibel's ROCE is mediocre, there may be more attractive investments around. Of course, you might find a fantastic investment by looking at a few good candidates. So take a peek at this free list of companies with modest (or no) debt, trading on a P/E below 20.
If you are like me, then you will not want to miss this free list of growing companies that insiders are buying.
If you spot an error that warrants correction, please contact the editor at editorial-team@simplywallst.com. This article by Simply Wall St is general in nature. It does not constitute a recommendation to buy or sell any stock, and does not take account of your objectives, or your financial situation. Simply Wall St has no position in the stocks mentioned.
We aim to bring you long-term focused research analysis driven by fundamental data. Note that our analysis may not factor in the latest price-sensitive company announcements or qualitative material. Thank you for reading.

