
How Does Intershop Holding's (VTX:ISN) P/E Compare To Its Industry, After The Share Price Drop?

To the annoyance of some shareholders, Intershop Holding (VTX:ISN) shares are down a considerable 30% in the last month. The recent drop has obliterated the annual return, with the share price now down 4.5% over that longer period.
All else being equal, a share price drop should make a stock more attractive to potential investors. In the long term, share prices tend to follow earnings per share, but in the short term prices bounce around in response to short term factors (which are not always obvious). The implication here is that long term investors have an opportunity when expectations of a company are too low. One way to gauge market expectations of a stock is to look at its Price to Earnings Ratio (PE Ratio). A high P/E implies that investors have high expectations of what a company can achieve compared to a company with a low P/E ratio.
View our latest analysis for Intershop Holding
Does Intershop Holding Have A Relatively High Or Low P/E For Its Industry?
Intershop Holding's P/E is 12.74. As you can see below Intershop Holding has a P/E ratio that is fairly close for the average for the real estate industry, which is 13.0.
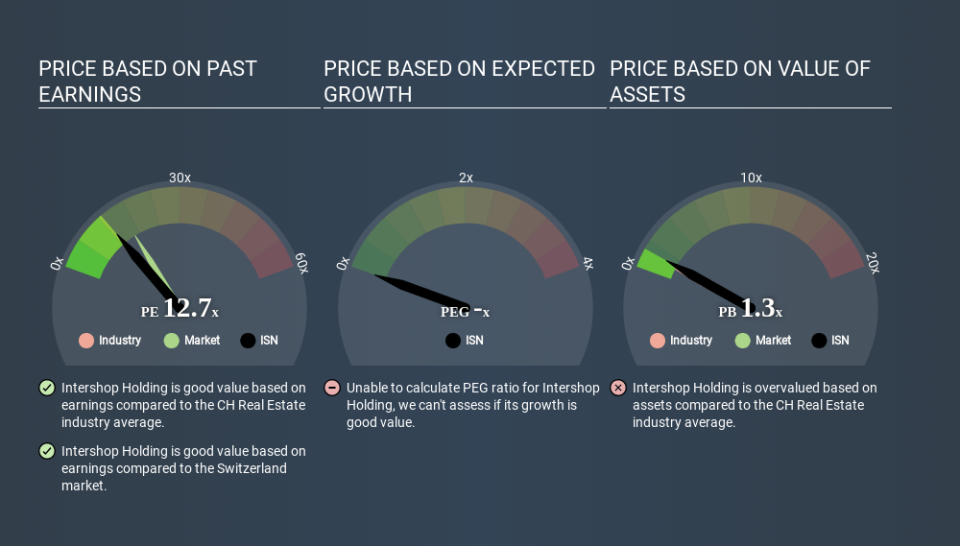
Intershop Holding's P/E tells us that market participants think its prospects are roughly in line with its industry. So if Intershop Holding actually outperforms its peers going forward, that should be a positive for the share price. Checking factors such as director buying and selling. could help you form your own view on if that will happen.
How Growth Rates Impact P/E Ratios
P/E ratios primarily reflect market expectations around earnings growth rates. That's because companies that grow earnings per share quickly will rapidly increase the 'E' in the equation. Therefore, even if you pay a high multiple of earnings now, that multiple will become lower in the future. So while a stock may look expensive based on past earnings, it could be cheap based on future earnings.
Intershop Holding shrunk earnings per share by 38% over the last year. But EPS is up 4.1% over the last 5 years.
A Limitation: P/E Ratios Ignore Debt and Cash In The Bank
Don't forget that the P/E ratio considers market capitalization. Thus, the metric does not reflect cash or debt held by the company. Hypothetically, a company could reduce its future P/E ratio by spending its cash (or taking on debt) to achieve higher earnings.
Such spending might be good or bad, overall, but the key point here is that you need to look at debt to understand the P/E ratio in context.
How Does Intershop Holding's Debt Impact Its P/E Ratio?
Intershop Holding has net debt worth 56% of its market capitalization. If you want to compare its P/E ratio to other companies, you should absolutely keep in mind it has significant borrowings.
The Verdict On Intershop Holding's P/E Ratio
Intershop Holding trades on a P/E ratio of 12.7, which is below the CH market average of 16.5. Given meaningful debt, and a lack of recent growth, the market looks to be extrapolating this recent performance; reflecting low expectations for the future. What can be absolutely certain is that the market has become significantly less optimistic about Intershop Holding over the last month, with the P/E ratio falling from 18.2 back then to 12.7 today. For those who prefer to invest with the flow of momentum, that might be a bad sign, but for a contrarian, it may signal opportunity.
Investors should be looking to buy stocks that the market is wrong about. If it is underestimating a company, investors can make money by buying and holding the shares until the market corrects itself. So this free visual report on analyst forecasts could hold the key to an excellent investment decision.
You might be able to find a better buy than Intershop Holding. If you want a selection of possible winners, check out this free list of interesting companies that trade on a P/E below 20 (but have proven they can grow earnings).
If you spot an error that warrants correction, please contact the editor at editorial-team@simplywallst.com. This article by Simply Wall St is general in nature. It does not constitute a recommendation to buy or sell any stock, and does not take account of your objectives, or your financial situation. Simply Wall St has no position in the stocks mentioned.
We aim to bring you long-term focused research analysis driven by fundamental data. Note that our analysis may not factor in the latest price-sensitive company announcements or qualitative material. Thank you for reading.

