
Does S.A.S. Dragon Holdings Limited's (HKG:1184) P/E Ratio Signal A Buying Opportunity?

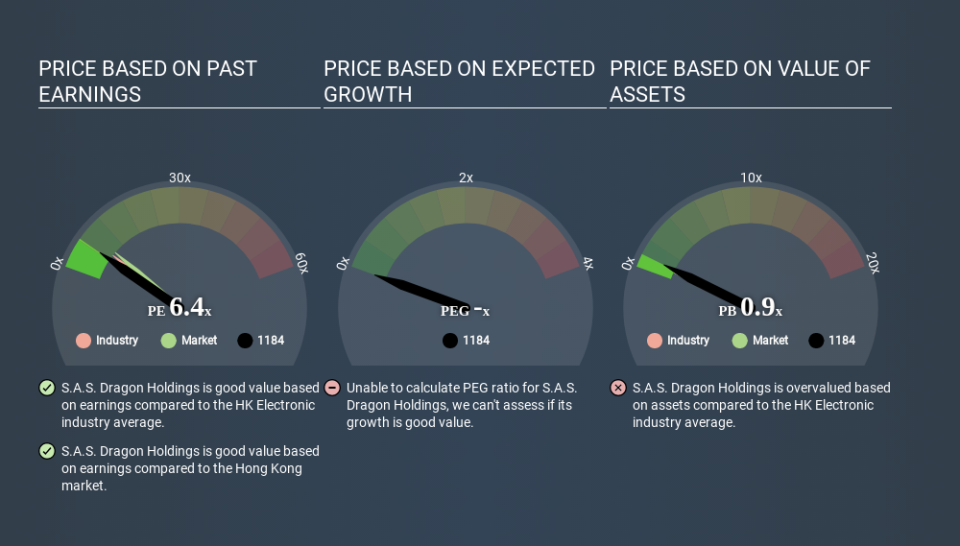
This article is for investors who would like to improve their understanding of price to earnings ratios (P/E ratios). We'll show how you can use S.A.S. Dragon Holdings Limited's (HKG:1184) P/E ratio to inform your assessment of the investment opportunity. Based on the last twelve months, S.A.S. Dragon Holdings's P/E ratio is 6.35. In other words, at today's prices, investors are paying HK$6.35 for every HK$1 in prior year profit.
Check out our latest analysis for S.A.S. Dragon Holdings
How Do You Calculate A P/E Ratio?
The formula for price to earnings is:
Price to Earnings Ratio = Price per Share ÷ Earnings per Share (EPS)
Or for S.A.S. Dragon Holdings:
P/E of 6.35 = HK$2.400 ÷ HK$0.378 (Based on the year to December 2019.)
(Note: the above calculation results may not be precise due to rounding.)
Is A High Price-to-Earnings Ratio Good?
A higher P/E ratio means that buyers have to pay a higher price for each HK$1 the company has earned over the last year. That isn't necessarily good or bad, but a high P/E implies relatively high expectations of what a company can achieve in the future.
How Does S.A.S. Dragon Holdings's P/E Ratio Compare To Its Peers?
The P/E ratio essentially measures market expectations of a company. If you look at the image below, you can see S.A.S. Dragon Holdings has a lower P/E than the average (7.9) in the electronic industry classification.
S.A.S. Dragon Holdings's P/E tells us that market participants think it will not fare as well as its peers in the same industry. While current expectations are low, the stock could be undervalued if the situation is better than the market assumes. It is arguably worth checking if insiders are buying shares, because that might imply they believe the stock is undervalued.
How Growth Rates Impact P/E Ratios
Probably the most important factor in determining what P/E a company trades on is the earnings growth. If earnings are growing quickly, then the 'E' in the equation will increase faster than it would otherwise. That means unless the share price increases, the P/E will reduce in a few years. Then, a lower P/E should attract more buyers, pushing the share price up.
S.A.S. Dragon Holdings shrunk earnings per share by 24% over the last year. But it has grown its earnings per share by 9.2% per year over the last five years.
Remember: P/E Ratios Don't Consider The Balance Sheet
It's important to note that the P/E ratio considers the market capitalization, not the enterprise value. So it won't reflect the advantage of cash, or disadvantage of debt. Hypothetically, a company could reduce its future P/E ratio by spending its cash (or taking on debt) to achieve higher earnings.
While growth expenditure doesn't always pay off, the point is that it is a good option to have; but one that the P/E ratio ignores.
Is Debt Impacting S.A.S. Dragon Holdings's P/E?
S.A.S. Dragon Holdings has net debt worth 68% of its market capitalization. This is enough debt that you'd have to make some adjustments before using the P/E ratio to compare it to a company with net cash.
The Bottom Line On S.A.S. Dragon Holdings's P/E Ratio
S.A.S. Dragon Holdings trades on a P/E ratio of 6.4, which is below the HK market average of 8.9. Given meaningful debt, and a lack of recent growth, the market looks to be extrapolating this recent performance; reflecting low expectations for the future.
When the market is wrong about a stock, it gives savvy investors an opportunity. If the reality for a company is not as bad as the P/E ratio indicates, then the share price should increase as the market realizes this. Although we don't have analyst forecasts you could get a better understanding of its growth by checking out this more detailed historical graph of earnings, revenue and cash flow.
But note: S.A.S. Dragon Holdings may not be the best stock to buy. So take a peek at this free list of interesting companies with strong recent earnings growth (and a P/E ratio below 20).
If you spot an error that warrants correction, please contact the editor at editorial-team@simplywallst.com. This article by Simply Wall St is general in nature. It does not constitute a recommendation to buy or sell any stock, and does not take account of your objectives, or your financial situation. Simply Wall St has no position in the stocks mentioned.
We aim to bring you long-term focused research analysis driven by fundamental data. Note that our analysis may not factor in the latest price-sensitive company announcements or qualitative material. Thank you for reading.

