
Crude Oil Price Update – Testing Upper End of Trading Range; Strike in Norway Could Fuel Short-Covering Rally
U.S. West Texas Intermediate crude oil futures are edging higher on Monday shortly after the regular session opening, ignoring concerns over rising coronavirus cases that are shattering hopes for a smooth recovery in fuel demand.
Traders also seem to be discounting potentially bearish reports that more crude is also being exported from OPEC producers Iran and Libya despite efforts by the Organization of the Petroleum Exporting Countries and their allies to limit output.
At 13:02 GMT, December WTI crude oil is trading $41.02, up $0.51 or +1.26%. The futures contract is headed for its first monthly loss since April as the reimposition of mobility curbs in some countries clouds the outlook on fuel demand recovery.
Despite the bearish outlook, one factor that may offer some near-term support to the market is the prospect of a strike in Norway.
Daily Swing Chart Technical Analysis
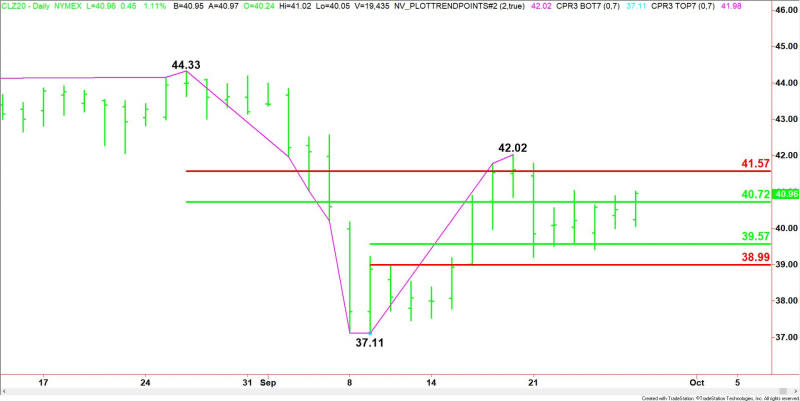
The main trend is down according to the daily swing chart, however, momentum has been trending higher since the formation of the closing price reversal bottom on September 9.
The main trend will change to up on a move through $44.33. A trade through $37.11 will signal a resumption of the downtrend.
The minor trend is also down. A trade through $42.02 will change the minor trend to up. This will confirm the shift in momentum.
The short-term range is $44.33 to $37.11. Its retracement zone at $40.72 to $41.57 is acting like resistance. It is currently being tested.
The minor range is $37.11 to $42.02. Its retracement zone at $39.57 to $38.99 is support.
Daily Swing Chart Technical Forecast
Based on the early price action, the direction of the December WTI crude oil market into the close on Monday is likely to be determined by trader reaction to the 50% level at $40.72.
Bullish Scenario
A sustained move over $40.72 will indicate the presence of buyers. If this creates enough upside momentum then look for a drive into the short-term Fibonacci level at $41.57.
Bearish Scenario
A sustained move under $40.72 will signal the presence of sellers. If this can create enough near-term momentum then look for the selling to possibly extend into the minor 50% level at $39.57.
Side Notes
We’re expecting the market to trade in a range over the near-term as traders adjust to the expected drop in demand, while continuing to respect the OPEC-led production cuts.
Essentially, we’re looking for resistance inside the retracement zone at $40.72 to $41.57 and support inside the retracement zone at $39.57 to $38.99. We’ll trade the range until a force comes along in the market that tells us not to. That force could be the strike in Norway.
For a look at all of today’s economic events, check out our economic calendar.
This article was originally posted on FX Empire

