
A Close Look At Hays plc’s (LON:HAS) 24% ROCE

Today we'll look at Hays plc (LON:HAS) and reflect on its potential as an investment. Specifically, we'll consider its Return On Capital Employed (ROCE), since that will give us an insight into how efficiently the business can generate profits from the capital it requires.
First, we'll go over how we calculate ROCE. Second, we'll look at its ROCE compared to similar companies. And finally, we'll look at how its current liabilities are impacting its ROCE.
Understanding Return On Capital Employed (ROCE)
ROCE is a measure of a company's yearly pre-tax profit (its return), relative to the capital employed in the business. Generally speaking a higher ROCE is better. Ultimately, it is a useful but imperfect metric. Renowned investment researcher Michael Mauboussin has suggested that a high ROCE can indicate that 'one dollar invested in the company generates value of more than one dollar'.
How Do You Calculate Return On Capital Employed?
The formula for calculating the return on capital employed is:
Return on Capital Employed = Earnings Before Interest and Tax (EBIT) ÷ (Total Assets - Current Liabilities)
Or for Hays:
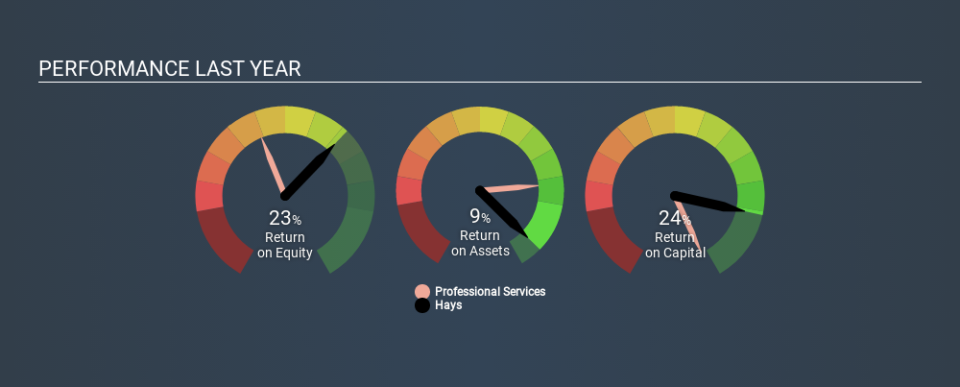
0.24 = UK£224m ÷ (UK£1.6b - UK£659m) (Based on the trailing twelve months to December 2019.)
So, Hays has an ROCE of 24%.
See our latest analysis for Hays
Is Hays's ROCE Good?
When making comparisons between similar businesses, investors may find ROCE useful. Using our data, we find that Hays's ROCE is meaningfully better than the 15% average in the Professional Services industry. I think that's good to see, since it implies the company is better than other companies at making the most of its capital. Setting aside the comparison to its industry for a moment, Hays's ROCE in absolute terms currently looks quite high.
You can click on the image below to see (in greater detail) how Hays's past growth compares to other companies.
It is important to remember that ROCE shows past performance, and is not necessarily predictive. Companies in cyclical industries can be difficult to understand using ROCE, as returns typically look high during boom times, and low during busts. ROCE is only a point-in-time measure. Future performance is what matters, and you can see analyst predictions in our free report on analyst forecasts for the company.
Do Hays's Current Liabilities Skew Its ROCE?
Current liabilities include invoices, such as supplier payments, short-term debt, or a tax bill, that need to be paid within 12 months. The ROCE equation subtracts current liabilities from capital employed, so a company with a lot of current liabilities appears to have less capital employed, and a higher ROCE than otherwise. To counteract this, we check if a company has high current liabilities, relative to its total assets.
Hays has total assets of UK£1.6b and current liabilities of UK£659m. Therefore its current liabilities are equivalent to approximately 42% of its total assets. Hays's ROCE is boosted somewhat by its middling amount of current liabilities.
The Bottom Line On Hays's ROCE
Despite this, it reports a high ROCE, and may be worth investigating further. There might be better investments than Hays out there, but you will have to work hard to find them . These promising businesses with rapidly growing earnings might be right up your alley.
I will like Hays better if I see some big insider buys. While we wait, check out this free list of growing companies with considerable, recent, insider buying.
If you spot an error that warrants correction, please contact the editor at editorial-team@simplywallst.com. This article by Simply Wall St is general in nature. It does not constitute a recommendation to buy or sell any stock, and does not take account of your objectives, or your financial situation. Simply Wall St has no position in the stocks mentioned.
We aim to bring you long-term focused research analysis driven by fundamental data. Note that our analysis may not factor in the latest price-sensitive company announcements or qualitative material. Thank you for reading.

