
Is Admicom Oyj's (HEL:ADMCM) 32% ROE Better Than Average?

One of the best investments we can make is in our own knowledge and skill set. With that in mind, this article will work through how we can use Return On Equity (ROE) to better understand a business. By way of learning-by-doing, we'll look at ROE to gain a better understanding of Admicom Oyj (HEL:ADMCM).
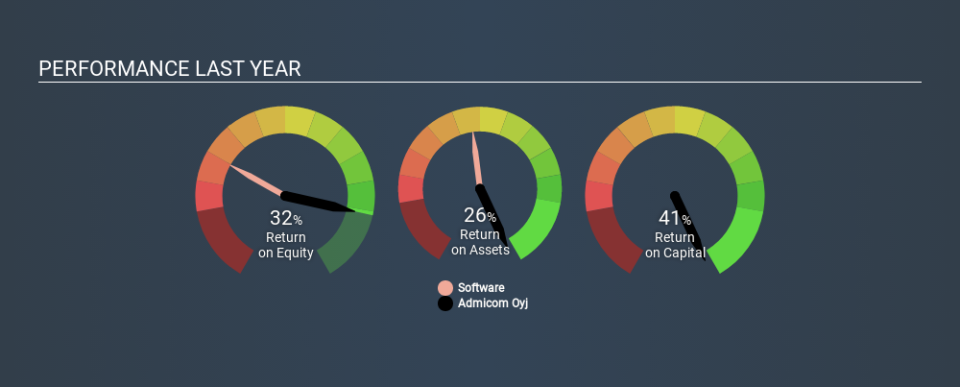
Over the last twelve months Admicom Oyj has recorded a ROE of 32%. Another way to think of that is that for every €1 worth of equity in the company, it was able to earn €0.32.
View our latest analysis for Admicom Oyj
How Do You Calculate Return On Equity?
The formula for ROE is:
Return on Equity = Net Profit (from continuing operations) ÷ Shareholders' Equity
Or for Admicom Oyj:
32% = €5.3m ÷ €16m (Based on the trailing twelve months to December 2019.)
Most know that net profit is the total earnings after all expenses, but the concept of shareholders' equity is a little more complicated. It is the capital paid in by shareholders, plus any retained earnings. You can calculate shareholders' equity by subtracting the company's total liabilities from its total assets.
What Does ROE Signify?
Return on Equity measures a company's profitability against the profit it has kept for the business (plus any capital injections). The 'return' is the profit over the last twelve months. That means that the higher the ROE, the more profitable the company is. So, all else equal, investors should like a high ROE. That means it can be interesting to compare the ROE of different companies.
Does Admicom Oyj Have A Good ROE?
Arguably the easiest way to assess company's ROE is to compare it with the average in its industry. Importantly, this is far from a perfect measure, because companies differ significantly within the same industry classification. As you can see in the graphic below, Admicom Oyj has a higher ROE than the average (6.3%) in the Software industry.
That's clearly a positive. I usually take a closer look when a company has a better ROE than industry peers. One data point to check is if insiders have bought shares recently.
How Does Debt Impact ROE?
Virtually all companies need money to invest in the business, to grow profits. The cash for investment can come from prior year profits (retained earnings), issuing new shares, or borrowing. In the first two cases, the ROE will capture this use of capital to grow. In the latter case, the debt required for growth will boost returns, but will not impact the shareholders' equity. That will make the ROE look better than if no debt was used.
Admicom Oyj's Debt And Its 32% ROE
Shareholders will be pleased to learn that Admicom Oyj has not one iota of net debt! Its high ROE indicates the business is high quality, but the fact that this was achieved without leverage is veritably impressive. After all, with cash on the balance sheet, a company has a lot more optionality in good times and bad.
The Bottom Line On ROE
Return on equity is a useful indicator of the ability of a business to generate profits and return them to shareholders. A company that can achieve a high return on equity without debt could be considered a high quality business. If two companies have around the same level of debt to equity, and one has a higher ROE, I'd generally prefer the one with higher ROE.
But ROE is just one piece of a bigger puzzle, since high quality businesses often trade on high multiples of earnings. The rate at which profits are likely to grow, relative to the expectations of profit growth reflected in the current price, must be considered, too. So you might want to take a peek at this data-rich interactive graph of forecasts for the company.
If you would prefer check out another company -- one with potentially superior financials -- then do not miss thisfree list of interesting companies, that have HIGH return on equity and low debt.
If you spot an error that warrants correction, please contact the editor at editorial-team@simplywallst.com. This article by Simply Wall St is general in nature. It does not constitute a recommendation to buy or sell any stock, and does not take account of your objectives, or your financial situation. Simply Wall St has no position in the stocks mentioned.
We aim to bring you long-term focused research analysis driven by fundamental data. Note that our analysis may not factor in the latest price-sensitive company announcements or qualitative material. Thank you for reading.

